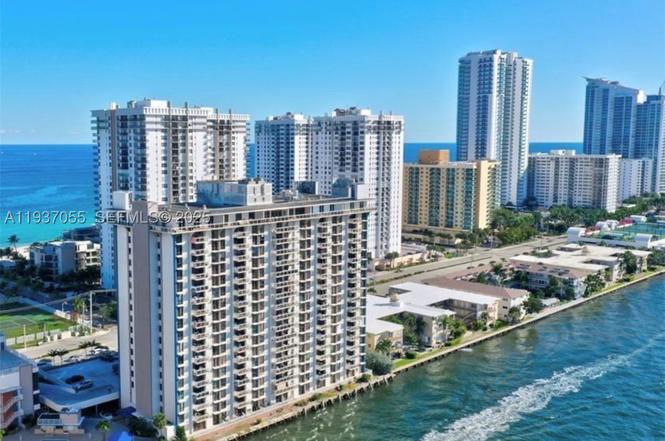
1600 S Ocean Dr Unit 3G
Hollywood, FL 33019
$300,000D
2 bd · 2.0 ba ·
1,400 sqft ·
Built 1972
· Condo
· Active
· 169 DOM
Cashflow @ list (25.0% down · 7.5%)
Estimated rent
$4,524/mo
Mortgage (P&I)
−$1,573
Tax + insurance
−$751
HOA
−$1,423
Vac / Maint / Mgmt
−$950
Net cashflow
$-173/mo
Annual
$-2,074/yr
Cap rate
5.60%
Cash-on-cash
-2.47%
DSCR
0.89
1% rule
1.51%
Cash to close
$84,000
Investor read
- This is a 2-bed/2.0-bath condo listed at $300k.
- At list price, monthly cash flow is $-173 ($-2k/yr) — negative.
- To cash-flow at today's rent, offer at most $269k (10.2% below list).
- Meets the 1% rule at list price ($5k rent vs $300k).
- It's been on market 169 days — a 12% lower offer ($264k) is reasonable based on typical stale-listing flexibility.
- Recommended offer: $264k (12.0% below list) — sets the bar for market timing.
- Local home prices are declining (-3.0%/yr); year-one equity from $2k of loan paydown is wiped out by about $9k of value loss. Plan a longer hold.
- Location reads 76/100 on livability (#232 in FL, #3,548 nationally) — a middle-class / working-renter tenant base. Strengths: commute A+, housing A+, crime B+; Watch: amenities D.
- Broward (suburban): math 42% / reading 53% proficiency, ranked #46 of 73 in FL (top 63%) — families likely to look elsewhere, expect single-tenant / working-renter base with shorter leases.
- Watch-outs: property tax is 2.5% of price; HOA is 31% of rent.
- Market conditions: Rents rising (+2.9%/yr); 828 active listings in the ZIP; 40 comparable units currently listed for rent nearby; rentals at typical pace (median 20d on market — plan ~3-4 weeks tenant-placement turnaround); solid renter incomes; 2,111 units permitted in Broward County in 2024 (1,265 in 5+ unit buildings).
- Broward County population projected at +34% by 2050 — long-run rental-demand tailwind backs the buy-and-hold thesis.
- 11 sale attempts since 9y ago; this cycle's ask is 13% above the opening price — seller raised mid-cycle; expect resistance to lowballs.
- Current owner paid $225k; 33% above their basis — modest negotiation headroom, anchor on the comps not their cost.
- Cap rate 5.6% vs local median 3.2% in Hollywood — top-decile yield for the area; either an underpriced asset or a hidden risk that comps aren't pricing in. Stress-test before assuming the spread holds.
- At $4,524/mo this rent would consume 56% of the median local household income ($96k/yr) (locally 563% of renters already pay >50% of income on rent) — very limited rent-growth headroom before tenants either downsize or default.
Questions for listing agent
- What do current leases actually rent for vs. the listed asking? Can we see a recent rent roll and the last 12 months of T-12 income?
- It's been on market 169 days. Have you received any prior offers? Is the seller open to a 12% concession, seller financing, or rate buy-down credit?
- Built in 1972 — when were the roof, HVAC, electrical panel, plumbing, and water heater last replaced?
- Property tax is high relative to price — has the assessment been appealed recently, and will the sale trigger a re-assessment?
- What does the HOA fee cover, when was the last increase, and are there any pending special assessments or reserve-fund shortfalls?
- Any open or pending special assessments — roof, HVAC, plumbing, elevator, façade? What's the per-unit balance and payoff schedule, and is the seller paying it off at close or rolling it to the buyer?
- Why hasn't it sold? Are there any deal-killer items the seller is aware of (foundation, flood, title, zoning, code violations)?
- Is there a deadline driving the sale (1031 exchange, divorce, estate, relocation)? That informs how much negotiation room exists.
CashFlowRE · CFR-2R106DDSFTCJB2
· Data 2 days ago
cashflowre.app · 2026-05-29