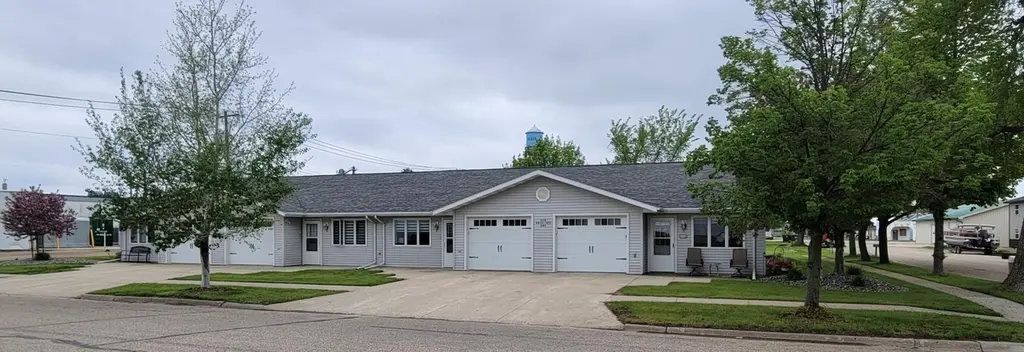
310 Antelope Ave SW
Forman, ND 58032
$325,000C-
9 bd · 3.9 ba ·
3,840 sqft ·
Built 1994
· MultiFamily
· Active
· 41 DOM
Cashflow @ list (25.0% down · 7.5%)
Estimated rent
$3,207/mo
Mortgage (P&I)
−$1,704
Tax + insurance
−$542
HOA
−$0
Vac / Maint / Mgmt
−$673
Net cashflow
$288/mo
Annual
$3,450/yr
Cap rate
7.35%
Cash-on-cash
3.79%
DSCR
1.17
1% rule
0.99%
Cash to close
$91,000
Investor read
- This is a 3 × 3-bed/?-bath units multifamily listed at $325k. Condition is rated fair.
- At list price, monthly cash flow is $288 ($3k/yr) — positive. Per door: $96/mo.
- The deal already cash-flows at list — no discount required.
- To meet the 1% rule (rent ≥ 1% of price), the offer needs to be $321k (1.3% below list).
- It's been on market 41 days — a 3% lower offer ($315k) is reasonable based on typical stale-listing flexibility.
- Recommended offer: $315k (3.0% below list) — sets the bar for market timing.
- In year one you build about $12k of equity ($2k loan paydown + $10k appreciation (3.0% local appreciation)).
- Location reads 76/100 on livability (#16 in ND, #3,437 nationally) — a middle-class / working-renter tenant base. Strengths: cost of living A+, housing A+, health & safety A+; Watch: amenities F, commute F.
- Sargent Central 6 (rural): math 40% / reading 35% proficiency, ranked #113 of 169 in ND (top 67%) — families likely to look elsewhere, expect single-tenant / working-renter base with shorter leases.
- Zoned schools: Sargent Central Elementary School (math 24% / reading 24%, grade F, #204 of 236 statewide, top 91%, 120 students, 0% FRL); Sargent Central High School (math 30% / reading 50%, grade F, #51 of 144 statewide, top 38%, 71 students, 0% FRL) — zoned schools average 0% FRL vs 23% district-wide (23 pts lower); this property's tenant base skews higher-income than the district average.
- Market conditions: 2 active listings in the ZIP; 1 units permitted in Sargent County in 2024 (0 in 5+ unit buildings).
- Sargent County population projected at +4% by 2050 — modest demand growth; plan on rents tracking national, not racing it.
- 3 sale attempts since 2y ago with the ask held roughly flat each time — persistent listings suggest the price (not the market) is what's stuck; bring a comps-based counter.
- At projected returns (3.0% appreciation + 3.0% rent growth), your $91k cash investment doubles in ~6 years — after that, you're playing with house money.
- By year 4, paydown + projected appreciation supports a ~$41k cash-out refi (75% LTV) — recoverable capital for the next deal without selling this one.
Questions for listing agent
- It's been on market 41 days. Have you received any prior offers? Is the seller open to a 3% concession, seller financing, or rate buy-down credit?
- Can we see the unit-by-unit rent roll, current vacancy, and any below-market leases? What's the average tenancy length?
- What capital expenditures (roof, boiler, parking lot, exteriors) have been made in the last 5 years, and what's planned in the next 2?
- Have any recent inspections been done? Can we get a copy of the seller's disclosures and any deferred-maintenance estimates?
- Is there a deadline driving the sale (1031 exchange, divorce, estate, relocation)? That informs how much negotiation room exists.
- What's the average days-on-market for RENTAL listings here right now (not sales)? A rising rental-DOM trend means longer vacancies and softer asking-rent achievability than the comps imply.
- What's the recent tenant-quality profile in this submarket — average credit score on applications, eviction rate, late-payment / NSF rate, and stable-employment percentage? A property-management company in the area should have these aggregated.
- How much new apartment / multifamily construction is in the pipeline within 1–3 miles? Heavy new supply (>2% of stock underway) typically softens rents 12–24 months out; light construction supports rent growth.
Repairs flagged (vision-AI assessment)
- Moderate: kitchen cabinets — dated and in need of updating
- Moderate: bathroom fixtures — standard and outdated
- Minor: landscaping — some overgrown areas
CashFlowRE · CFR-2RC64V7GB2RJEK
· Data 5 h ago
cashflowre.app · 2026-05-29