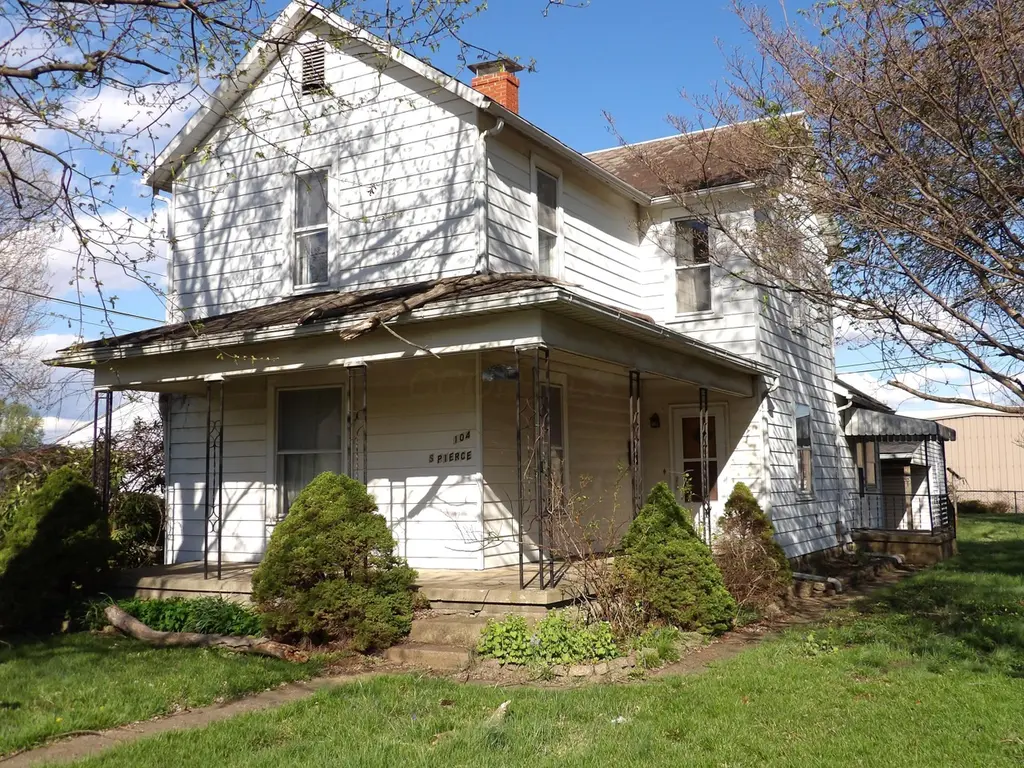
104 S Pierce Ave
Lancaster, OH 43130
$145,000B-
2 bd · 1.5 ba ·
1,524 sqft ·
Built 1900
· SingleFamily
· Active
· 61 DOM
Cashflow @ list (25.0% down · 7.5%)
Estimated rent
$1,645/mo
Mortgage (P&I)
−$760
Tax + insurance
−$254
HOA
−$0
Vac / Maint / Mgmt
−$345
Net cashflow
$285/mo
Annual
$3,418/yr
Cap rate
8.65%
Cash-on-cash
8.42%
DSCR
1.37
1% rule
1.13%
Cash to close
$40,600
Investor read
- This is a 2-bed/1.5-bath single-family listed at $145k.
- At list price, monthly cash flow is $285 ($3k/yr) — positive.
- The deal already cash-flows at list — no discount required.
- Meets the 1% rule at list price ($2k rent vs $145k).
- It's been on market 61 days — a 6% lower offer ($136k) is reasonable based on typical stale-listing flexibility.
- Recommended offer: $136k (6.0% below list) — sets the bar for market timing.
- Local home prices are declining (-3.0%/yr); year-one equity from $1k of loan paydown is wiped out by about $4k of value loss. Plan a longer hold.
- Location reads 86/100 on livability (#41 in OH, #423 nationally) — a professional / high-income tenant draw. Strengths: amenities A+, cost of living A+, housing A+; Watch: crime D, employment D.
- Lancaster City (town): math 38% / reading 51% proficiency, ranked #504 of 656 in OH (top 77%) — families likely to look elsewhere, expect single-tenant / working-renter base with shorter leases.
- Watch-outs: built in 1900 — expect roof / HVAC / electrical / plumbing capex.
- Market conditions: Rents rising fast (+5.2%/yr); 204 active listings in the ZIP; 6 comparable units currently listed for rent nearby; rentals lingering (median 44d on market — plan ~5-8 weeks vacancy on turnover, expect pricing pressure); 50% of comp listings sitting > 30 days — soft ceiling on asking rent; 475 units permitted in Fairfield County in 2024 (0 in 5+ unit buildings).
- Fairfield County population projected at +8% by 2050 — modest demand growth; plan on rents tracking national, not racing it.
- 2 sale attempts; this cycle's ask has dropped $20k (12%) from the opening price — seller is motivated, your offer sets the floor, not the list.
- Current owner paid $62k; list at $145k implies a 132% gain — meaningful room to come down on a strong offer.
- At projected returns (-3.0% appreciation + 5.2% rent growth), your $41k cash investment doubles in ~10 years — after that, you're playing with house money.
- Cap rate 8.7% vs local median 4.0% in Lancaster — top-decile yield for the area; either an underpriced asset or a hidden risk that comps aren't pricing in. Stress-test before assuming the spread holds.
Questions for listing agent
- It's been on market 61 days. Have you received any prior offers? Is the seller open to a 6% concession, seller financing, or rate buy-down credit?
- Built in 1900 — when were the roof, HVAC, electrical panel, plumbing, and water heater last replaced?
- Why hasn't it sold? Are there any deal-killer items the seller is aware of (foundation, flood, title, zoning, code violations)?
- Is there a deadline driving the sale (1031 exchange, divorce, estate, relocation)? That informs how much negotiation room exists.
- Crime grade is D in this area — have there been break-ins, vandalism, or insurance claims at this property in the last 3 years? What carrier currently insures it and at what premium?
- What's the average days-on-market for RENTAL listings here right now (not sales)? A rising rental-DOM trend means longer vacancies and softer asking-rent achievability than the comps imply.
- What's the recent tenant-quality profile in this submarket — average credit score on applications, eviction rate, late-payment / NSF rate, and stable-employment percentage? A property-management company in the area should have these aggregated.
- How much new for-sale + rental construction is in the pipeline within 1–3 miles? Heavy new supply typically softens prices + rents 12–24 months out; constrained supply supports both.
CashFlowRE · CFR-2S72EW3SP1FMBT
· Data 1 week ago
cashflowre.app · 2026-05-29