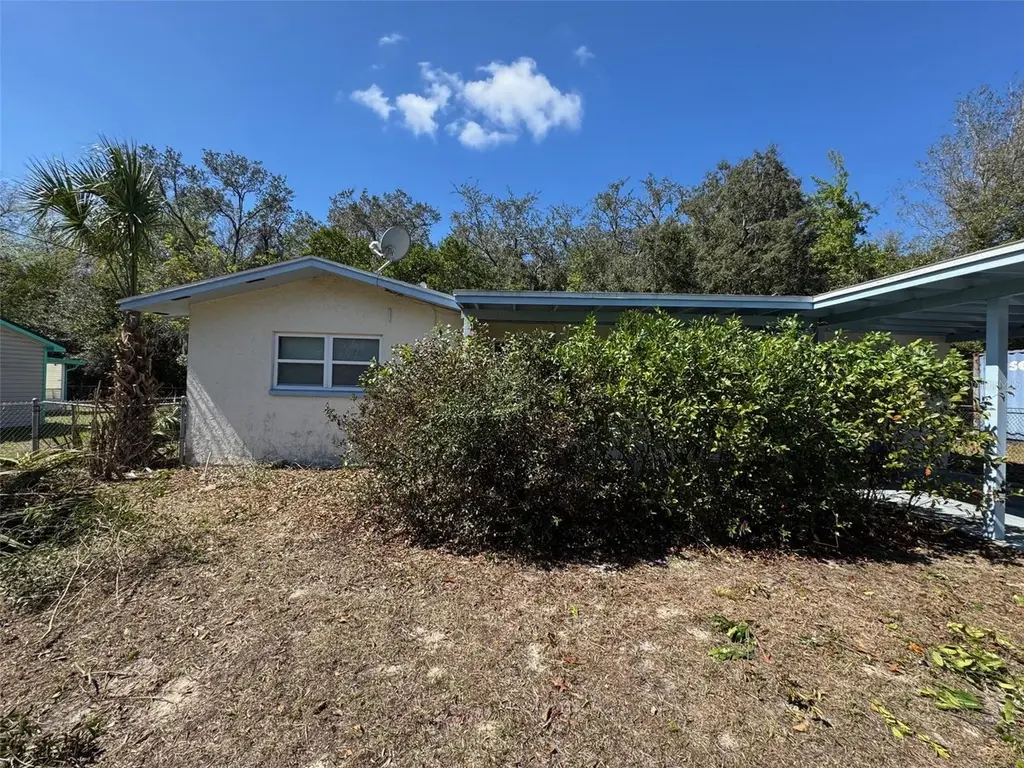
7025 W Village Dr
Homosassa Springs, FL 34446
$118,000B+
3 bd · 2.0 ba ·
1,125 sqft ·
Built 1974
· SingleFamily
· Pending
· 7 DOM
Cashflow @ list (25.0% down · 7.5%)
Estimated rent
$1,950/mo
Mortgage (P&I)
−$619
Tax + insurance
−$303
HOA
−$0
Vac / Maint / Mgmt
−$409
Net cashflow
$618/mo
Annual
$7,421/yr
Cap rate
13.26%
Cash-on-cash
24.87%
DSCR
2.11
1% rule
1.65%
Cash to close
$33,040
Investor read
- This is a 3-bed/2.0-bath single-family listed at $118k.
- At list price, monthly cash flow is $618 ($7k/yr) — positive.
- The deal already cash-flows at list — no discount required.
- Meets the 1% rule at list price ($2k rent vs $118k).
- Only 7 days on market — expect competitive offers; lowballing is unlikely to land.
- Local home prices are declining (-3.0%/yr); year-one equity from $816 of loan paydown is wiped out by about $4k of value loss. Plan a longer hold.
- Location reads 71/100 on livability (#391 in FL) — a middle-class / working-renter tenant base. Strengths: cost of living A+, housing A+, health & safety A+; Watch: crime C-, schools F, amenities F.
- Citrus (rural): math 49% / reading 50% proficiency, ranked #44 of 73 in FL (top 60%) — families likely to look elsewhere, expect single-tenant / working-renter base with shorter leases.
- Watch-outs: flood insurance adds $66/mo.
- Market conditions: 582 active listings in the ZIP; 2 comparable units currently listed for rent nearby; 2,443 units permitted in Citrus County in 2024 (0 in 5+ unit buildings).
- Citrus County population projected to shrink 10% by 2050 — rents likely to lag national; underwrite the cash flow, not the appreciation.
- Current owner paid $45k; list at $118k implies a 162% gain — meaningful room to come down on a strong offer.
- At projected returns (-3.0% appreciation + 3.0% rent growth), your $33k cash investment doubles in ~6 years — after that, you're playing with house money.
- Climate carrying-cost: severe flood risk; severe wind risk, 99% chance of damaging wind over 30y; major wildfire risk; extreme-heat days projected 7→26/yr by 2055 (HVAC capex compounding) — expect insurance premiums to compound above CPI over the hold.
- Cap rate 13.3% vs local median 5.9% in Homosassa Springs — top-decile yield for the area; either an underpriced asset or a hidden risk that comps aren't pricing in. Stress-test before assuming the spread holds.
- This rent runs 40% of the median local income ($59k/yr) — at the standard rent-burdened threshold; future hikes will face affordability resistance.
Questions for listing agent
- Built in 1974 — when were the roof, HVAC, electrical panel, plumbing, and water heater last replaced?
- What's the actual annual flood-insurance premium (NFIP or private), and is the property in a SFHA with mandatory coverage?
- Is there a deadline driving the sale (1031 exchange, divorce, estate, relocation)? That informs how much negotiation room exists.
- Schools are F-rated, which usually means shorter tenancies and higher turnover. Who's the typical renter profile here, and what's been the actual vacancy rate?
- What's the average days-on-market for RENTAL listings here right now (not sales)? A rising rental-DOM trend means longer vacancies and softer asking-rent achievability than the comps imply.
- What's the recent tenant-quality profile in this submarket — average credit score on applications, eviction rate, late-payment / NSF rate, and stable-employment percentage? A property-management company in the area should have these aggregated.
- How much new for-sale + rental construction is in the pipeline within 1–3 miles? Heavy new supply typically softens prices + rents 12–24 months out; constrained supply supports both.
CashFlowRE · CFR-2SDVAV4ADABS5M
· Data 3 weeks ago
cashflowre.app · 2026-05-29