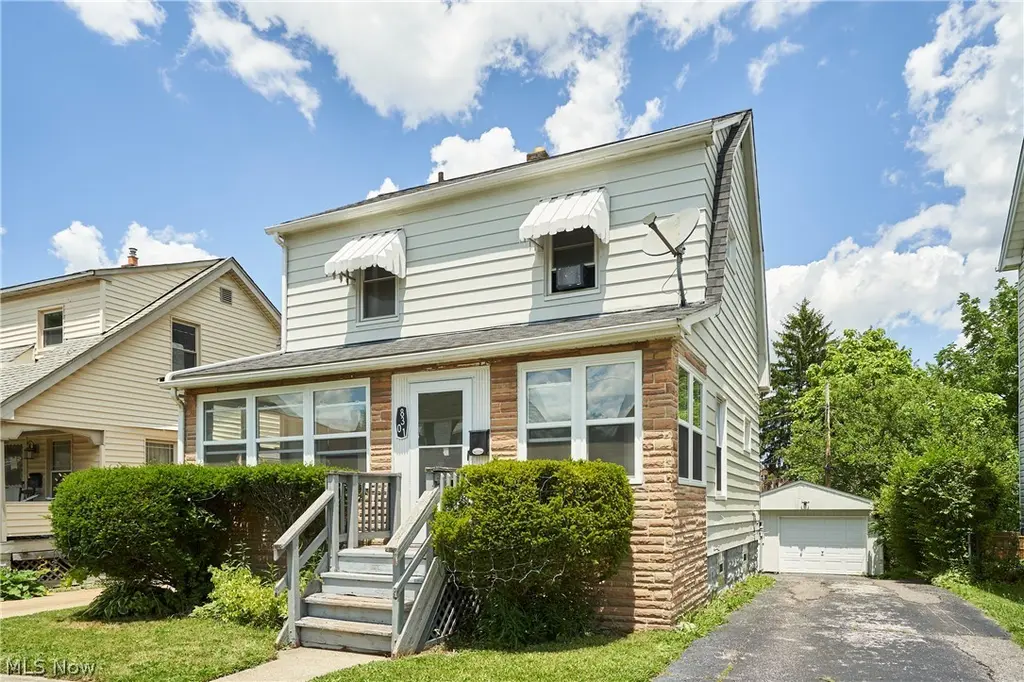
8301 Vista Ave
Garfield Heights, OH 44125
$148,900C
4 bd · 2.0 ba ·
1,612 sqft ·
Built 1922
· SingleFamily
· Active
· 3 DOM
Cashflow @ list (25.0% down · 7.5%)
Estimated rent
$1,725/mo
Mortgage (P&I)
−$781
Tax + insurance
−$364
HOA
−$0
Vac / Maint / Mgmt
−$362
Net cashflow
$218/mo
Annual
$2,622/yr
Cap rate
8.05%
Cash-on-cash
6.29%
DSCR
1.28
1% rule
1.16%
Cash to close
$41,692
Investor read
- This is a 4-bed/2.0-bath single-family listed at $149k.
- At list price, monthly cash flow is $218 ($3k/yr) — positive.
- The deal already cash-flows at list — no discount required.
- Meets the 1% rule at list price ($2k rent vs $149k).
- Only 3 days on market — expect competitive offers; lowballing is unlikely to land.
- Local home prices are declining (-3.0%/yr); year-one equity from $1k of loan paydown is wiped out by about $4k of value loss. Plan a longer hold.
- Location reads 67/100 on livability (#593 in OH) — a middle-class / working-renter tenant base. Strengths: cost of living A+, housing A+, health & safety A; Watch: crime D-, amenities F, commute F.
- Garfield Heights City Schools (suburban): math 8% / reading 22% proficiency, ranked #643 of 656 in OH (top 98%) — low school quality limits family demand, transient renter base, plan for 1-2y turnover; 64% free/reduced lunch — lower-income household profile, screen leases tightly.
- Zoned schools: William Foster Elementary School (math 10% / reading 23%, grade F, #1,363 of 1,584 statewide, top 86%, 511 students, 0% FRL); Garfield Heights Middle School (math 10% / reading 21%, grade F, #626 of 654 statewide, top 96%, 746 students, 0% FRL); Garfield Heights High School (math 4% / reading 23%, grade F, #718 of 781 statewide, top 92%, 1,109 students, 0% FRL) — zoned schools average 0% FRL vs 64% district-wide (64 pts lower); this property's tenant base skews higher-income than the district average.
- Watch-outs: built in 1922 — expect roof / HVAC / electrical / plumbing capex.
- Market conditions: Rents rising fast (+4.8%/yr); 126 active listings in the ZIP; 21 comparable units currently listed for rent nearby; rentals at typical pace (median 18d on market — plan ~3-4 weeks tenant-placement turnaround); 1,441 units permitted in Cuyahoga County in 2024 (700 in 5+ unit buildings).
- Cuyahoga County population projected to shrink 8% by 2050 — rents likely to lag national; underwrite the cash flow, not the appreciation.
- 6 sale attempts since 32y ago with the ask held roughly flat each time — persistent listings suggest the price (not the market) is what's stuck; bring a comps-based counter.
- Current owner paid $80k; list at $149k implies a 86% gain — meaningful room to come down on a strong offer.
- This rent runs 36% of the median local income ($57k/yr) — at the standard rent-burdened threshold; future hikes will face affordability resistance.
Questions for listing agent
- Built in 1922 — when were the roof, HVAC, electrical panel, plumbing, and water heater last replaced?
- Is there a deadline driving the sale (1031 exchange, divorce, estate, relocation)? That informs how much negotiation room exists.
- Crime grade is D in this area — have there been break-ins, vandalism, or insurance claims at this property in the last 3 years? What carrier currently insures it and at what premium?
- What's the average days-on-market for RENTAL listings here right now (not sales)? A rising rental-DOM trend means longer vacancies and softer asking-rent achievability than the comps imply.
- What's the recent tenant-quality profile in this submarket — average credit score on applications, eviction rate, late-payment / NSF rate, and stable-employment percentage? A property-management company in the area should have these aggregated.
- How much new for-sale + rental construction is in the pipeline within 1–3 miles? Heavy new supply typically softens prices + rents 12–24 months out; constrained supply supports both.
CashFlowRE · CFR-2TQVTTDNVZZV53
· Data 14 h ago
cashflowre.app · 2026-05-29