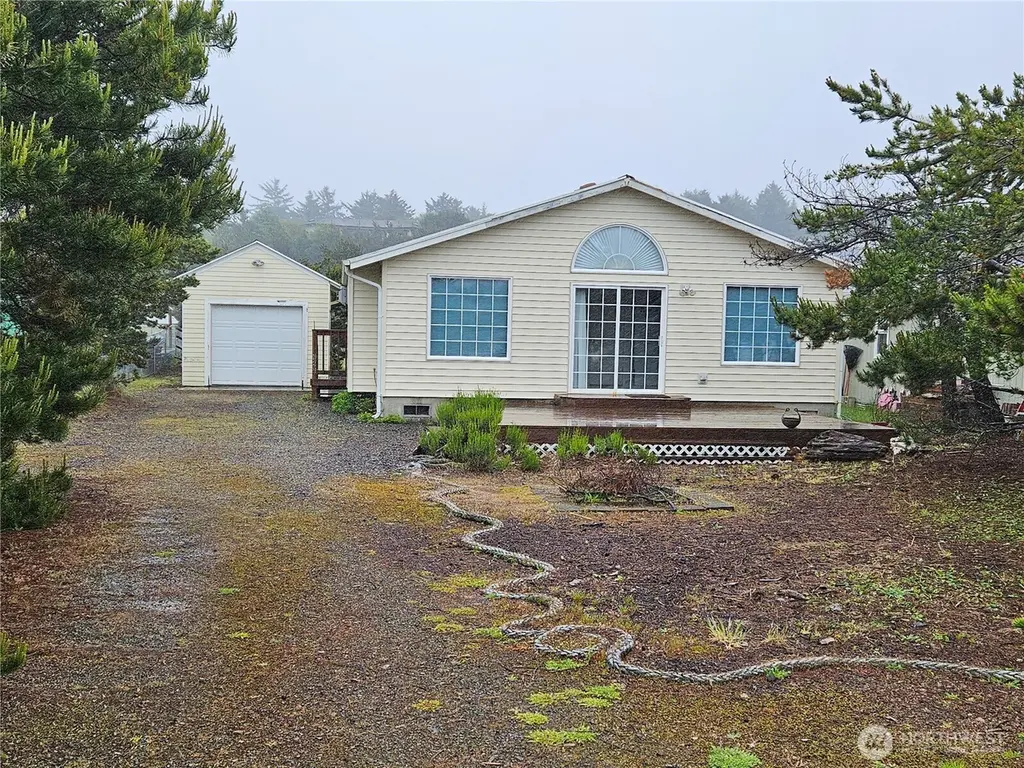
33406 H Pl
Ocean Park, WA 98640
$315,000D
2 bd · 2.0 ba ·
1,232 sqft ·
Built 1995
· SingleFamily
· Active
· 19 DOM
Cashflow @ list (25.0% down · 7.5%)
Estimated rent
$2,305/mo
Mortgage (P&I)
−$1,652
Tax + insurance
−$318
HOA
−$65
Vac / Maint / Mgmt
−$484
Net cashflow
$-214/mo
Annual
$-2,569/yr
Cap rate
5.48%
Cash-on-cash
-2.91%
DSCR
0.87
1% rule
0.73%
Cash to close
$88,200
Investor read
- This is a 2-bed/2.0-bath single-family listed at $315k.
- At list price, monthly cash flow is $-214 ($-3k/yr) — negative.
- To cash-flow at today's rent, offer at most $277k (12.0% below list).
- To meet the 1% rule (rent ≥ 1% of price), the offer needs to be $230k (26.8% below list).
- It's been on market 19 days — a 2% lower offer ($310k) is reasonable based on typical stale-listing flexibility.
- Recommended offer: $230k (26.8% below list) — sets the bar for 1% rule.
- Local home prices are declining (-3.0%/yr); year-one equity from $2k of loan paydown is wiped out by about $9k of value loss. Plan a longer hold.
- Location reads 72/100 on livability (#216 in WA) — a middle-class / working-renter tenant base. Strengths: housing A+, health & safety A+, crime A; Watch: commute D+, employment D+, amenities F.
- Ocean Beach School District (rural): math 34% / reading 50% proficiency, ranked #212 of 291 in WA (top 73%) — families likely to look elsewhere, expect single-tenant / working-renter base with shorter leases.
- Zoned schools: Ocean Park Elementary (196 students, 76% FRL); Hilltop Elementary School (236 students, 70% FRL); Ilwaco High School (296 students, 64% FRL).
- Market conditions: 320 active listings in the ZIP; 90 units permitted in Pacific County in 2024 (0 in 5+ unit buildings).
- Pacific County population projected at -10% by 2050 — secular population decline; favor cash flow + early exit over multi-decade hold.
- 3 sale attempts since 20y ago with the ask held roughly flat each time — persistent listings suggest the price (not the market) is what's stuck; bring a comps-based counter.
- Current owner paid $180k; list at $315k implies a 75% gain — meaningful room to come down on a strong offer.
- Cap rate 5.5% vs local median 4.2% in Ocean Park — top-decile yield for the area; either an underpriced asset or a hidden risk that comps aren't pricing in. Stress-test before assuming the spread holds.
Questions for listing agent
- What do current leases actually rent for vs. the listed asking? Can we see a recent rent roll and the last 12 months of T-12 income?
- What does the HOA fee cover, when was the last increase, and are there any pending special assessments or reserve-fund shortfalls?
- Is there a deadline driving the sale (1031 exchange, divorce, estate, relocation)? That informs how much negotiation room exists.
- Schools are F-rated, which usually means shorter tenancies and higher turnover. Who's the typical renter profile here, and what's been the actual vacancy rate?
- The area grade is low — what's the realistic commute time and amenity access for the typical tenant pool here? Any planned neighborhood developments (good or bad) we should know about?
- What's the average days-on-market for RENTAL listings here right now (not sales)? A rising rental-DOM trend means longer vacancies and softer asking-rent achievability than the comps imply.
- What's the recent tenant-quality profile in this submarket — average credit score on applications, eviction rate, late-payment / NSF rate, and stable-employment percentage? A property-management company in the area should have these aggregated.
- How much new for-sale + rental construction is in the pipeline within 1–3 miles? Heavy new supply typically softens prices + rents 12–24 months out; constrained supply supports both.
CashFlowRE · CFR-2X5D3WBT9M09S2
· Data 19 h ago
cashflowre.app · 2026-05-29