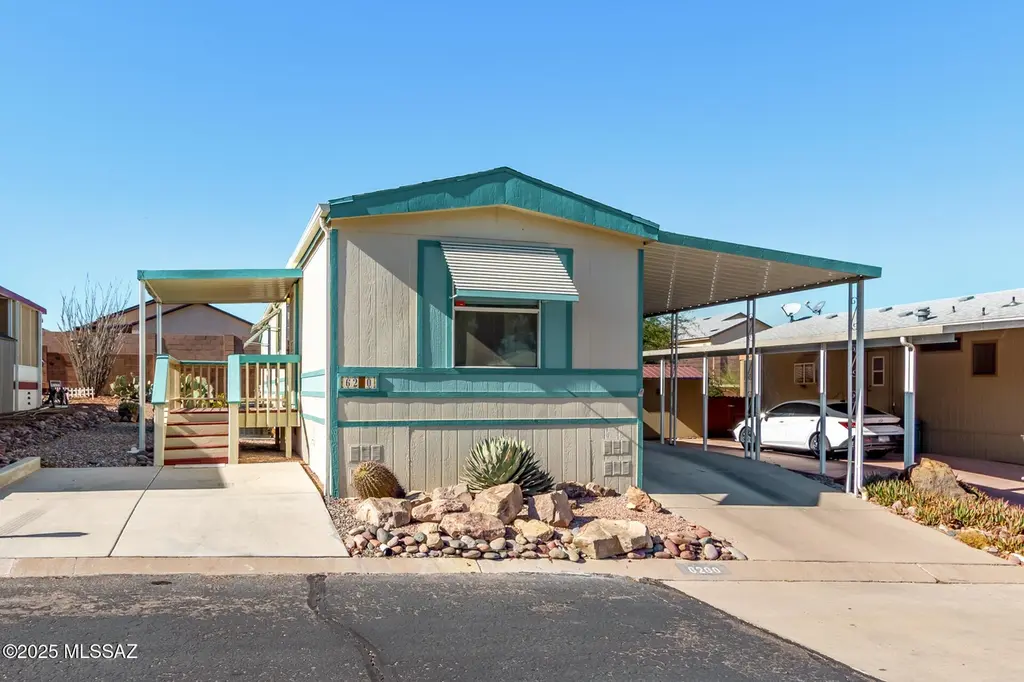
6260 S Waterton Dr
Drexel Heights, AZ 85746
$124,000D+
2 bd · 2.0 ba ·
924 sqft ·
Built 1996
· Manufactured
· Active
· 195 DOM
Cashflow @ list (25.0% down · 7.5%)
Estimated rent
$1,292/mo
Mortgage (P&I)
−$650
Tax + insurance
−$207
HOA
−$127
Vac / Maint / Mgmt
−$271
Net cashflow
$37/mo
Annual
$440/yr
Cap rate
6.65%
Cash-on-cash
1.27%
DSCR
1.06
1% rule
1.04%
Cash to close
$34,720
Investor read
- This is a 2-bed/2.0-bath manufactured listed at $124k.
- At list price, monthly cash flow is $37 ($440/yr) — positive.
- The deal already cash-flows at list — no discount required.
- Meets the 1% rule at list price ($1k rent vs $124k).
- It's been on market 195 days — a 12% lower offer ($109k) is reasonable based on typical stale-listing flexibility.
- Recommended offer: $109k (12.0% below list) — sets the bar for market timing.
- Local home prices are declining (-3.0%/yr); year-one equity from $857 of loan paydown is wiped out by about $4k of value loss. Plan a longer hold.
- Location reads 66/100 on livability (#73 in AZ) — a middle-class / working-renter tenant base. Strengths: cost of living A+, housing A+; Watch: schools F, crime F, amenities F.
- Tucson Unified District (4403) (urban): math 14% / reading 23% proficiency, ranked #190 of 249 in AZ (top 76%) — low school quality limits family demand, transient renter base, plan for 1-2y turnover.
- Market conditions: Rents soft (-0.2%/yr); 148 active listings in the ZIP; 3 comparable units currently listed for rent nearby; rentals lingering (median 44d on market — plan ~5-8 weeks vacancy on turnover, expect pricing pressure); 67% of comp listings sitting > 30 days — soft ceiling on asking rent; 5,268 units permitted in Pima County in 2024 (996 in 5+ unit buildings).
- Pima County population projected at +8% by 2050 — modest demand growth; plan on rents tracking national, not racing it.
- 4 sale attempts since 9y ago; this cycle's ask has dropped $36k (22%) from the opening price — seller is motivated, your offer sets the floor, not the list.
- Current owner paid $90k; 38% above their basis — modest negotiation headroom, anchor on the comps not their cost.
- Climate carrying-cost: major flood risk; major wildfire risk; extreme-heat days projected 7→19/yr by 2055 (HVAC capex compounding) — expect insurance premiums to compound above CPI over the hold.
- Cap rate 6.6% vs local median 3.6% in Drexel Heights — top-decile yield for the area; either an underpriced asset or a hidden risk that comps aren't pricing in. Stress-test before assuming the spread holds.
Questions for listing agent
- It's been on market 195 days. Have you received any prior offers? Is the seller open to a 12% concession, seller financing, or rate buy-down credit?
- What does the HOA fee cover, when was the last increase, and are there any pending special assessments or reserve-fund shortfalls?
- Why hasn't it sold? Are there any deal-killer items the seller is aware of (foundation, flood, title, zoning, code violations)?
- Is there a deadline driving the sale (1031 exchange, divorce, estate, relocation)? That informs how much negotiation room exists.
- Schools are F-rated, which usually means shorter tenancies and higher turnover. Who's the typical renter profile here, and what's been the actual vacancy rate?
- Crime grade is F in this area — have there been break-ins, vandalism, or insurance claims at this property in the last 3 years? What carrier currently insures it and at what premium?
- The area grade is low — what's the realistic commute time and amenity access for the typical tenant pool here? Any planned neighborhood developments (good or bad) we should know about?
- What's the average days-on-market for RENTAL listings here right now (not sales)? A rising rental-DOM trend means longer vacancies and softer asking-rent achievability than the comps imply.
CashFlowRE · CFR-32KB0WAPPS8HPH
· Data 2 days ago
cashflowre.app · 2026-05-29