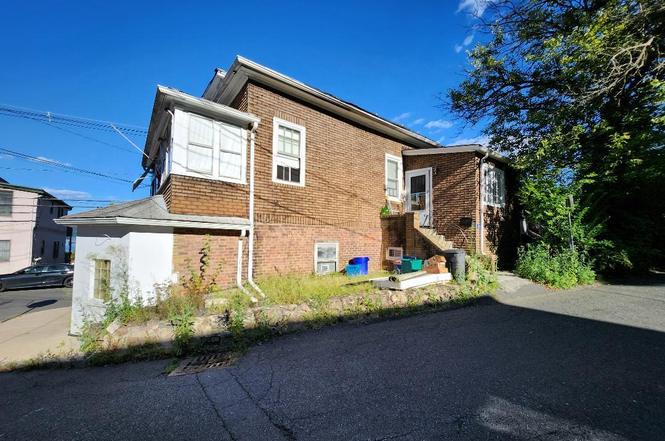
48 - 50 Kinney St
Piermont, NY 10968
$350,000B
5 bd · 2.0 ba ·
1,692 sqft ·
Built 1900
· MultiFamily
· Pending
· 10 DOM
Cashflow @ list (25.0% down · 7.5%)
Estimated rent
$5,365/mo
Mortgage (P&I)
−$1,835
Tax + insurance
−$639
HOA
−$0
Vac / Maint / Mgmt
−$1,127
Net cashflow
$1,764/mo
Annual
$21,168/yr
Cap rate
12.53%
Cash-on-cash
22.28%
DSCR
1.99
1% rule
1.53%
Cash to close
$98,000
Investor read
- This is a 2 × 2-bed/1.0-bath units multifamily listed at $350k.
- At list price, monthly cash flow is $2k ($21k/yr) — positive. Per door: $882/mo.
- The deal already cash-flows at list — no discount required.
- Meets the 1% rule at list price ($5k rent vs $350k).
- Only 10 days on market — expect competitive offers; lowballing is unlikely to land.
- Local home prices are declining (-3.0%/yr); year-one equity from $2k of loan paydown is wiped out by about $10k of value loss. Plan a longer hold.
- Location reads 67/100 on livability (#571 in NY) — a middle-class / working-renter tenant base. Strengths: crime A+, employment A+, housing B; Watch: amenities F, commute F, cost of living F.
- South Orangetown Central School District (suburban): math 52% / reading 66% proficiency, ranked #183 of 590 in NY (top 31%) — acceptable for families but not a draw, mixed tenant base, ~2y average lease; only 8% free/reduced lunch — higher-income household profile.
- Zoned schools: William O Schaefer Elementary School (576 students, 18% FRL); South Orangetown Middle School (math 39% / reading 65%, grade C+, #241 of 729 statewide, top 35%, 633 students, 20% FRL); Tappan Zee High School (math 94% / reading 92%, grade A+, #147 of 1,100 statewide, top 14%, 953 students, 22% FRL).
- Zoned-school proficiency averages 72% at this address vs 59% district-wide (+14 pts) — the actual schools serving this property are materially stronger than the South Orangetown Central School District average implies; a family-tenant draw the district grade alone would hide.
- Watch-outs: flood insurance adds $56/mo; built in 1900 — expect roof / HVAC / electrical / plumbing capex.
- Market conditions: 29 active listings in the ZIP; high-income renter base; 429 units permitted in Rockland County in 2024 (231 in 5+ unit buildings).
- Rockland County population projected at +7% by 2050 — modest demand growth; plan on rents tracking national, not racing it.
- At projected returns (-3.0% appreciation + 3.0% rent growth), your $98k cash investment doubles in ~6 years — after that, you're playing with house money.
- Climate carrying-cost: severe flood risk; major wind risk, 27% chance of damaging wind over 30y; extreme-heat days projected 7→16/yr by 2055 (HVAC capex compounding) — expect insurance premiums to compound above CPI over the hold.
- Cap rate 12.5% vs local median 0.4% in Piermont — top-decile yield for the area; either an underpriced asset or a hidden risk that comps aren't pricing in. Stress-test before assuming the spread holds.
- This rent runs 44% of the median local income ($145k/yr) — at the standard rent-burdened threshold; future hikes will face affordability resistance.
Questions for listing agent
- Can we see the unit-by-unit rent roll, current vacancy, and any below-market leases? What's the average tenancy length?
- What capital expenditures (roof, boiler, parking lot, exteriors) have been made in the last 5 years, and what's planned in the next 2?
- Built in 1900 — when were the roof, HVAC, electrical panel, plumbing, and water heater last replaced?
- What's the actual annual flood-insurance premium (NFIP or private), and is the property in a SFHA with mandatory coverage?
- Is there a deadline driving the sale (1031 exchange, divorce, estate, relocation)? That informs how much negotiation room exists.
- What's the average days-on-market for RENTAL listings here right now (not sales)? A rising rental-DOM trend means longer vacancies and softer asking-rent achievability than the comps imply.
- What's the recent tenant-quality profile in this submarket — average credit score on applications, eviction rate, late-payment / NSF rate, and stable-employment percentage? A property-management company in the area should have these aggregated.
- How much new apartment / multifamily construction is in the pipeline within 1–3 miles? Heavy new supply (>2% of stock underway) typically softens rents 12–24 months out; light construction supports rent growth.
CashFlowRE · CFR-32M7YX38GSPVYC
· Data 3 weeks ago
cashflowre.app · 2026-05-29