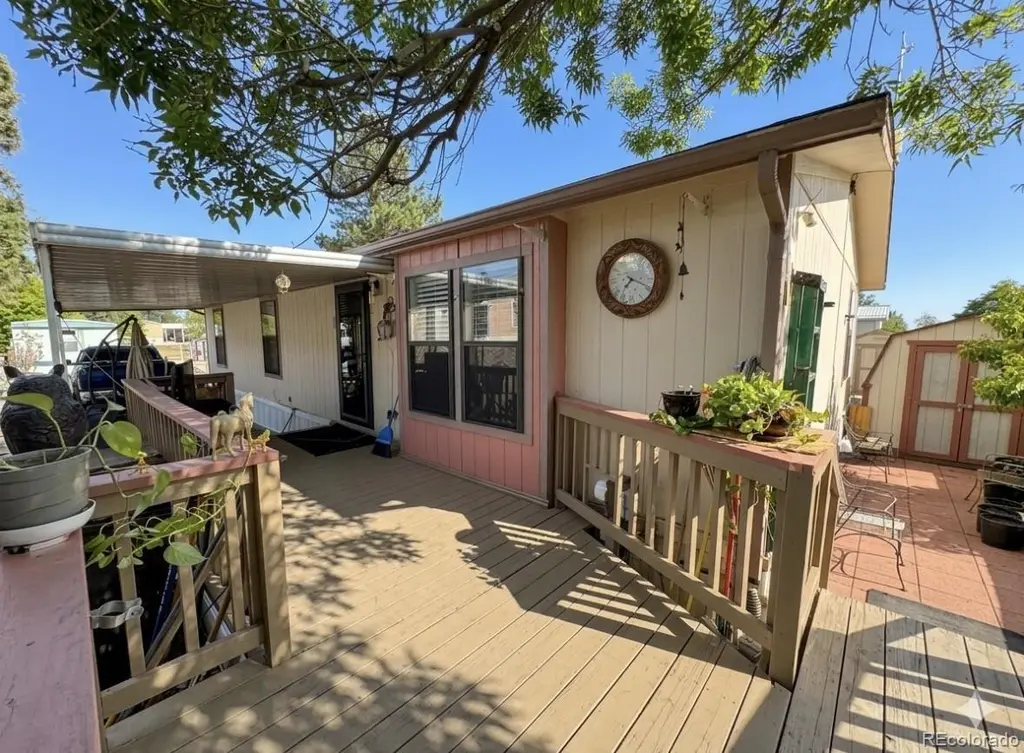
4500 19th St
Boulder, CO 80304
$220,000C
3 bd · 2.0 ba ·
4,178 sqft ·
Built 2011
· Land
· Active
· 5 DOM
Cashflow @ list (25.0% down · 7.5%)
Estimated rent
$3,549/mo
Mortgage (P&I)
−$1,154
Tax + insurance
−$367
HOA
−$1,030
Vac / Maint / Mgmt
−$745
Net cashflow
$253/mo
Annual
$3,039/yr
Cap rate
7.67%
Cash-on-cash
4.93%
DSCR
1.22
1% rule
1.61%
Cash to close
$61,600
Investor read
- This is a 3-bed/2.0-bath land listed at $220k.
- At list price, monthly cash flow is $253 ($3k/yr) — positive.
- The deal already cash-flows at list — no discount required.
- Meets the 1% rule at list price ($4k rent vs $220k).
- Only 5 days on market — expect competitive offers; lowballing is unlikely to land.
- Local home prices are declining (-3.0%/yr); year-one equity from $2k of loan paydown is wiped out by about $7k of value loss. Plan a longer hold.
- Location reads 77/100 on livability (#24 in CO, #2,958 nationally) — a middle-class / working-renter tenant base. Strengths: amenities A+, commute A+, health & safety A+; Watch: crime D+, cost of living F.
- Boulder Valley School District No. Re2 (urban): math 49% / reading 67% proficiency, ranked #6 of 86 in CO (top 7%) — acceptable for families but not a draw, mixed tenant base, ~2y average lease; only 16% free/reduced lunch — higher-income household profile.
- Watch-outs: HOA is 29% of rent.
- Market conditions: Rents rising (+1.8%/yr); 258 active listings in the ZIP; 1 comparable units currently listed for rent nearby; high-income renter base; 1,688 units permitted in Boulder County in 2024 (1,136 in 5+ unit buildings).
- Boulder County population projected at +40% by 2050 — long-run rental-demand tailwind backs the buy-and-hold thesis.
- 27 sale attempts since 6y ago; this cycle's ask is 127% above the opening price — seller raised mid-cycle; expect resistance to lowballs.
- Current owner paid $45k; list at $220k implies a 389% gain — meaningful room to come down on a strong offer.
- Climate carrying-cost: severe wildfire risk — expect insurance premiums to compound above CPI over the hold.
- Cap rate 7.7% vs local median 1.7% in Boulder — top-decile yield for the area; either an underpriced asset or a hidden risk that comps aren't pricing in. Stress-test before assuming the spread holds.
- This rent runs 34% of the median local income ($127k/yr) — at the standard rent-burdened threshold; future hikes will face affordability resistance.
Questions for listing agent
- What does the HOA fee cover, when was the last increase, and are there any pending special assessments or reserve-fund shortfalls?
- Is there a deadline driving the sale (1031 exchange, divorce, estate, relocation)? That informs how much negotiation room exists.
- Schools are B-rated — typically a magnet for longer-tenancy family renters. What's the average tenant stay here, and is there a school-zone premium baked into asking?
- Crime grade is D in this area — have there been break-ins, vandalism, or insurance claims at this property in the last 3 years? What carrier currently insures it and at what premium?
- What's the average days-on-market for RENTAL listings here right now (not sales)? A rising rental-DOM trend means longer vacancies and softer asking-rent achievability than the comps imply.
- What's the recent tenant-quality profile in this submarket — average credit score on applications, eviction rate, late-payment / NSF rate, and stable-employment percentage? A property-management company in the area should have these aggregated.
- How much new for-sale + rental construction is in the pipeline within 1–3 miles? Heavy new supply typically softens prices + rents 12–24 months out; constrained supply supports both.
CashFlowRE · CFR-3542SH0V1A2V9Z
· Data 2 h ago
cashflowre.app · 2026-05-29