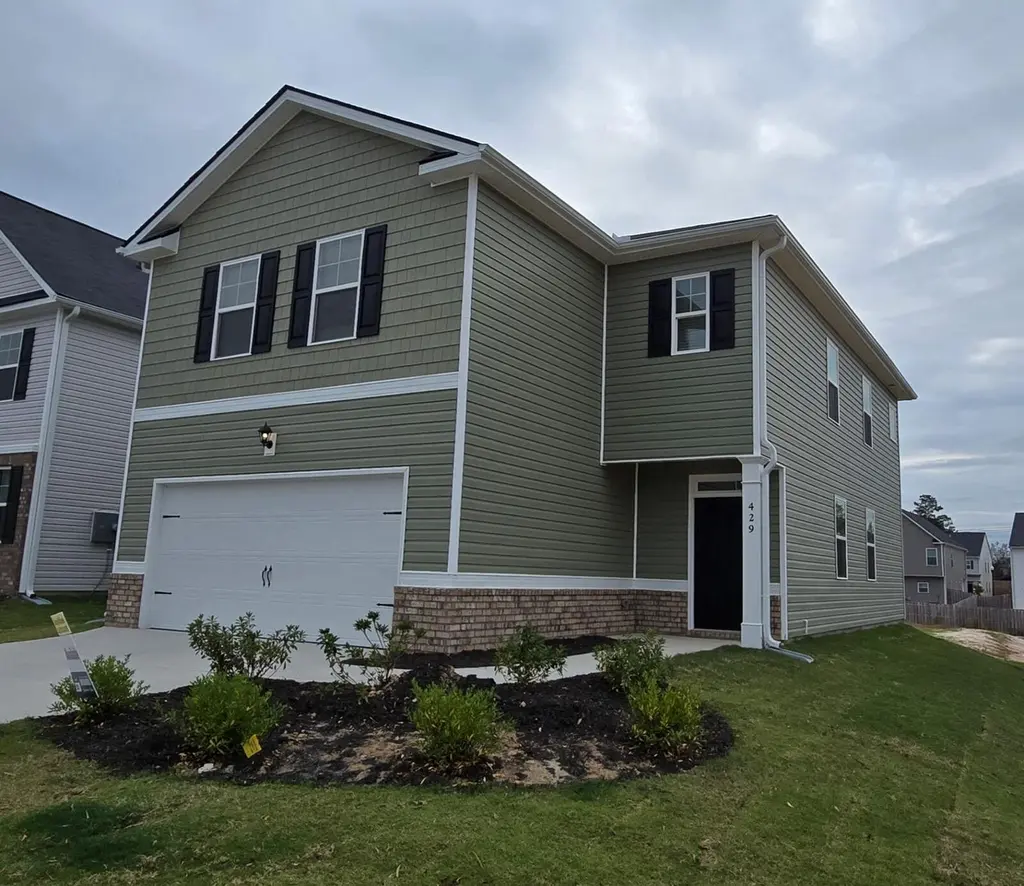
429 Shipwreck Dr
Beech Island, SC 29842
$255,000F
4 bd · 2.5 ba ·
2,214 sqft ·
Built 2024
· SingleFamily
· Pending
· 7 DOM
Cashflow @ list (25.0% down · 7.5%)
Estimated rent
$2,122/mo
Mortgage (P&I)
−$1,544
Tax + insurance
−$239
HOA
−$29
Vac / Maint / Mgmt
−$446
Net cashflow
$-135/mo
Annual
$-1,626/yr
Cap rate
5.74%
Cash-on-cash
-1.97%
DSCR
0.91
1% rule
0.72%
Cash to close
$82,449
Investor read
- This is a 4-bed/2.5-bath single-family listed at $255k.
- At list price, monthly cash flow is $-135 ($-2k/yr) — negative.
- The deal already cash-flows at list — no discount required.
- To meet the 1% rule (rent ≥ 1% of price), the offer needs to be $212k (16.8% below list).
- Only 7 days on market — expect competitive offers; lowballing is unlikely to land.
- Recommended offer: $212k (16.8% below list) — sets the bar for 1% rule.
- Local home prices are declining (-3.0%/yr); year-one equity from $2k of loan paydown is wiped out by about $9k of value loss. Plan a longer hold.
- Location reads: area grade F — affects rentability + tenant quality, not the cash-flow math above.
- Aiken 01 (suburban): math 31% / reading 44% proficiency, ranked #36 of 80 in SC (top 45%) — families likely to look elsewhere, expect single-tenant / working-renter base with shorter leases.
- Zoned schools: Redcliffe Elementary (math 41% / reading 37%, grade F, #301 of 597 statewide, top 51%, 631 students, 100% FRL); Jackson Stem Magnet (math 19% / reading 33%, grade F, #159 of 229 statewide, top 70%, 373 students, 100% FRL); Silver Bluff High (math 42% / reading 82%, grade B-, #99 of 196 statewide, top 53%, 708 students, 65% FRL) — zoned schools average 88% FRL vs 54% district-wide (35 pts higher); higher-poverty schools than district average — tighter screening recommended.
- Market conditions: 138 active listings in the ZIP; 2 comparable units currently listed for rent nearby; 2,500 units permitted in Aiken County in 2024 (1,023 in 5+ unit buildings).
- Aiken County population projected at +9% by 2050 — modest demand growth; plan on rents tracking national, not racing it.
- 4 sale attempts since 2y ago with the ask held roughly flat each time — persistent listings suggest the price (not the market) is what's stuck; bring a comps-based counter.
- Cap rate 5.7% vs local median 3.1% in Beech Island — top-decile yield for the area; either an underpriced asset or a hidden risk that comps aren't pricing in. Stress-test before assuming the spread holds.
Questions for listing agent
- What do current leases actually rent for vs. the listed asking? Can we see a recent rent roll and the last 12 months of T-12 income?
- What does the HOA fee cover, when was the last increase, and are there any pending special assessments or reserve-fund shortfalls?
- Is there a deadline driving the sale (1031 exchange, divorce, estate, relocation)? That informs how much negotiation room exists.
- The area grade is low — what's the realistic commute time and amenity access for the typical tenant pool here? Any planned neighborhood developments (good or bad) we should know about?
- What's the average days-on-market for RENTAL listings here right now (not sales)? A rising rental-DOM trend means longer vacancies and softer asking-rent achievability than the comps imply.
- What's the recent tenant-quality profile in this submarket — average credit score on applications, eviction rate, late-payment / NSF rate, and stable-employment percentage? A property-management company in the area should have these aggregated.
- How much new for-sale + rental construction is in the pipeline within 1–3 miles? Heavy new supply typically softens prices + rents 12–24 months out; constrained supply supports both.
CashFlowRE · CFR-380C0W8QKN7WQW
· Data 3 weeks ago
cashflowre.app · 2026-05-29