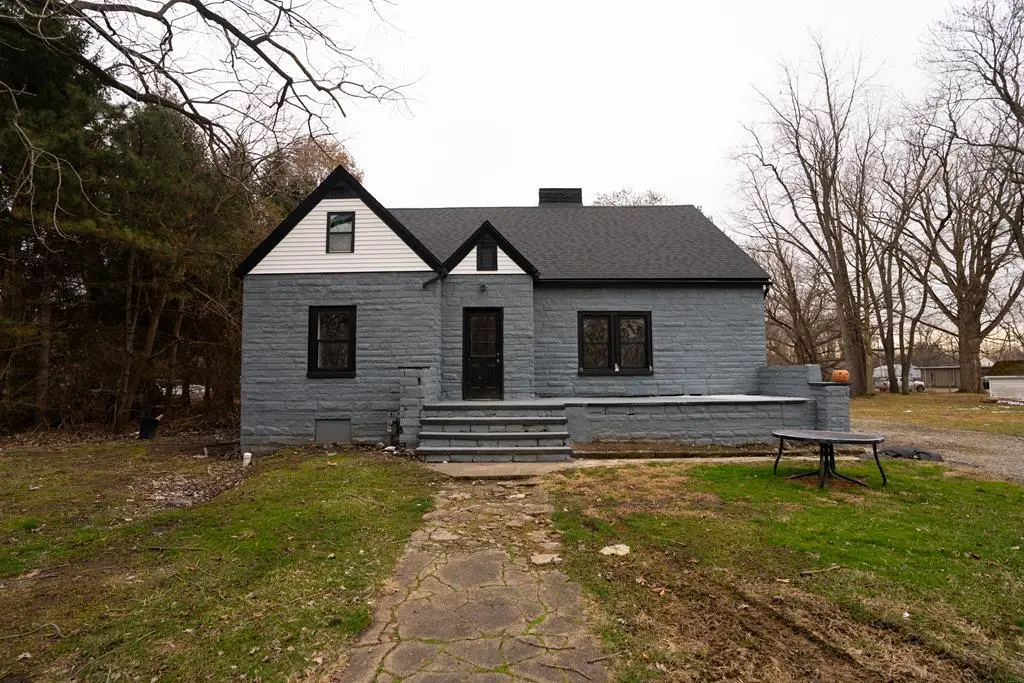
945 Virginia Ave
Ashland, OH 44805
$150,000B-
3 bd · 2.0 ba ·
2,117 sqft ·
Built 1944
· MultiFamily
· Active
· 16 DOM
Cashflow @ list (25.0% down · 7.5%)
Estimated rent
$2,058/mo
Mortgage (P&I)
−$787
Tax + insurance
−$93
HOA
−$0
Vac / Maint / Mgmt
−$432
Net cashflow
$747/mo
Annual
$8,958/yr
Cap rate
12.27%
Cash-on-cash
21.33%
DSCR
1.95
1% rule
1.37%
Cash to close
$42,000
Investor read
- This is a 2 × 2-bed/1.0-bath units multifamily listed at $150k.
- At list price, monthly cash flow is $747 ($9k/yr) — positive. Per door: $373/mo.
- The deal already cash-flows at list — no discount required.
- Meets the 1% rule at list price ($2k rent vs $150k).
- It's been on market 16 days — a 2% lower offer ($148k) is reasonable based on typical stale-listing flexibility.
- Recommended offer: $148k (1.5% below list) — sets the bar for market timing.
- Local home prices are declining (-3.0%/yr); year-one equity from $1k of loan paydown is wiped out by about $4k of value loss. Plan a longer hold.
- Location reads 72/100 on livability (#373 in OH) — a middle-class / working-renter tenant base. Strengths: cost of living A+, housing A+, crime B+; Watch: employment C-, amenities D-, commute F.
- Ashland City (town): math 70% / reading 69% proficiency, ranked #165 of 656 in OH (top 25%) — acceptable for families but not a draw, mixed tenant base, ~2y average lease.
- Watch-outs: built in 1944 — expect roof / HVAC / electrical / plumbing capex.
- Market conditions: Rents rising fast (+7.1%/yr); 122 active listings in the ZIP; 3 comparable units currently listed for rent nearby; rentals lingering (median 44d on market — plan ~5-8 weeks vacancy on turnover, expect pricing pressure); 100% of comp listings sitting > 30 days — soft ceiling on asking rent; 61 units permitted in Ashland County in 2024 (0 in 5+ unit buildings).
- Ashland County population projected at -13% by 2050 — secular population decline; favor cash flow + early exit over multi-decade hold.
- 4 sale attempts since 2y ago with the ask held roughly flat each time — persistent listings suggest the price (not the market) is what's stuck; bring a comps-based counter.
- At projected returns (-3.0% appreciation + 7.1% rent growth), your $42k cash investment doubles in ~5 years — after that, you're playing with house money.
- Cap rate 12.3% vs local median 3.8% in Ashland — top-decile yield for the area; either an underpriced asset or a hidden risk that comps aren't pricing in. Stress-test before assuming the spread holds.
- This rent runs 36% of the median local income ($68k/yr) — at the standard rent-burdened threshold; future hikes will face affordability resistance.
Questions for listing agent
- Can we see the unit-by-unit rent roll, current vacancy, and any below-market leases? What's the average tenancy length?
- What capital expenditures (roof, boiler, parking lot, exteriors) have been made in the last 5 years, and what's planned in the next 2?
- Built in 1944 — when were the roof, HVAC, electrical panel, plumbing, and water heater last replaced?
- Is there a deadline driving the sale (1031 exchange, divorce, estate, relocation)? That informs how much negotiation room exists.
- Schools are B-rated — typically a magnet for longer-tenancy family renters. What's the average tenant stay here, and is there a school-zone premium baked into asking?
- What's the average days-on-market for RENTAL listings here right now (not sales)? A rising rental-DOM trend means longer vacancies and softer asking-rent achievability than the comps imply.
- What's the recent tenant-quality profile in this submarket — average credit score on applications, eviction rate, late-payment / NSF rate, and stable-employment percentage? A property-management company in the area should have these aggregated.
- How much new apartment / multifamily construction is in the pipeline within 1–3 miles? Heavy new supply (>2% of stock underway) typically softens rents 12–24 months out; light construction supports rent growth.
CashFlowRE · CFR-396B5TAP2GA3MR
· Data 2 days ago
cashflowre.app · 2026-05-29