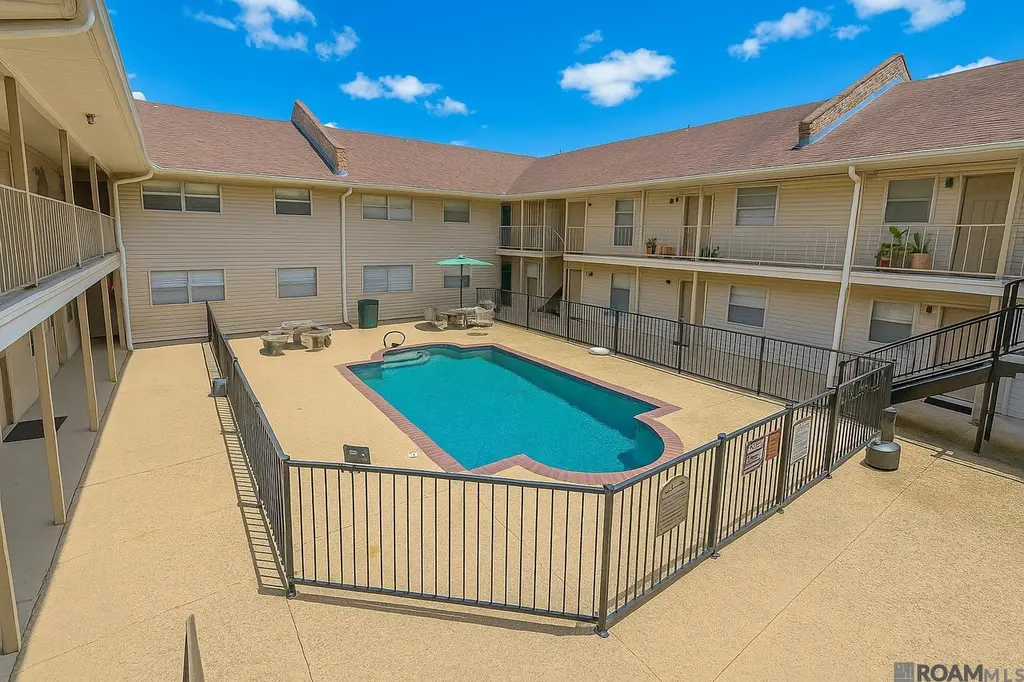
4518 Y A Tittle Ave #1
Baton Rouge, LA 70820
$47,500B+
2 bd · 1.0 ba ·
748 sqft ·
Built 1998
· Condo
· Active
· 251 DOM
Cashflow @ list (25.0% down · 7.5%)
Estimated rent
$1,062/mo
Mortgage (P&I)
−$249
Tax + insurance
−$110
HOA
−$286
Vac / Maint / Mgmt
−$223
Net cashflow
$194/mo
Annual
$2,325/yr
Cap rate
11.19%
Cash-on-cash
17.48%
DSCR
1.78
1% rule
2.23%
Cash to close
$13,300
Investor read
- This is a 2-bed/1.0-bath condo listed at $48k.
- At list price, monthly cash flow is $194 ($2k/yr) — positive.
- The deal already cash-flows at list — no discount required.
- Meets the 1% rule at list price ($1k rent vs $48k).
- It's been on market 251 days — a 12% lower offer ($42k) is reasonable based on typical stale-listing flexibility.
- Recommended offer: $42k (12.0% below list) — sets the bar for market timing.
- Local home prices are declining (-3.0%/yr); year-one equity from $328 of loan paydown is wiped out by about $1k of value loss. Plan a longer hold.
- Location reads 74/100 on livability (#24 in LA, #4,535 nationally) — a middle-class / working-renter tenant base. Strengths: commute A+, cost of living A+, health & safety A+; Watch: amenities D, crime F, employment D-.
- East Baton Rouge Parish (urban): math 22% / reading 34% proficiency, ranked #47 of 98 in LA (top 48%) — low school quality limits family demand, transient renter base, plan for 1-2y turnover; 77% free/reduced lunch — lower-income household profile, screen leases tightly.
- Watch-outs: HOA is 27% of rent.
- Market conditions: Rents rising (+2.8%/yr); 315 active listings in the ZIP; 18 comparable units currently listed for rent nearby; rentals at typical pace (median 19d on market — plan ~3-4 weeks tenant-placement turnaround); 2,252 units permitted in East Baton Rouge Parish in 2024 (440 in 5+ unit buildings).
- East Baton Rouge County population projected at +4% by 2050 — modest demand growth; plan on rents tracking national, not racing it.
- 12 sale attempts since 22y ago; this cycle's ask has dropped $11k (19%) from the opening price — seller is motivated, your offer sets the floor, not the list.
- Current owner paid $34k; 40% above their basis — modest negotiation headroom, anchor on the comps not their cost.
- At projected returns (-3.0% appreciation + 2.8% rent growth), your $13k cash investment doubles in ~7 years — after that, you're playing with house money.
- Cap rate 11.2% vs local median 4.3% in Baton Rouge — top-decile yield for the area; either an underpriced asset or a hidden risk that comps aren't pricing in. Stress-test before assuming the spread holds.
Questions for listing agent
- It's been on market 251 days. Have you received any prior offers? Is the seller open to a 12% concession, seller financing, or rate buy-down credit?
- What does the HOA fee cover, when was the last increase, and are there any pending special assessments or reserve-fund shortfalls?
- Any open or pending special assessments — roof, HVAC, plumbing, elevator, façade? What's the per-unit balance and payoff schedule, and is the seller paying it off at close or rolling it to the buyer?
- Why hasn't it sold? Are there any deal-killer items the seller is aware of (foundation, flood, title, zoning, code violations)?
- Is there a deadline driving the sale (1031 exchange, divorce, estate, relocation)? That informs how much negotiation room exists.
- Crime grade is F in this area — have there been break-ins, vandalism, or insurance claims at this property in the last 3 years? What carrier currently insures it and at what premium?
- What's the average days-on-market for RENTAL listings here right now (not sales)? A rising rental-DOM trend means longer vacancies and softer asking-rent achievability than the comps imply.
- What's the recent tenant-quality profile in this submarket — average credit score on applications, eviction rate, late-payment / NSF rate, and stable-employment percentage? A property-management company in the area should have these aggregated.
CashFlowRE · CFR-3AEM418X9V02A1
· Data 2 days ago
cashflowre.app · 2026-05-29