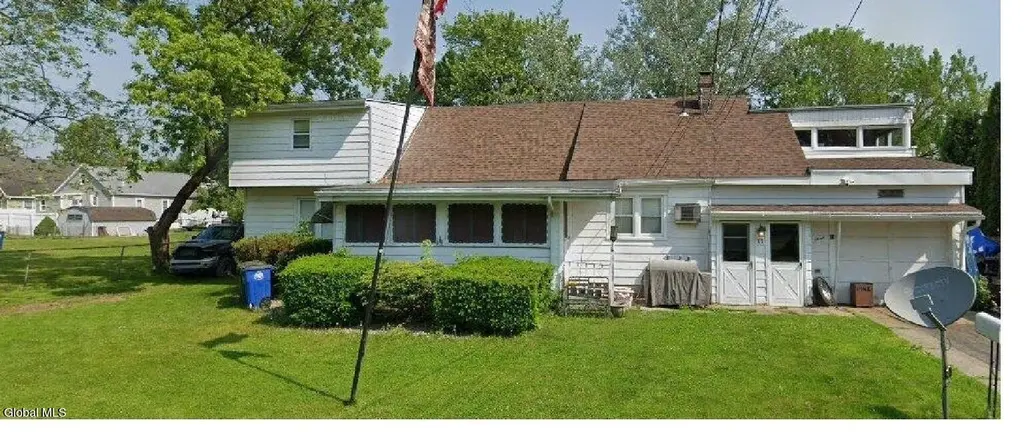
11 Miller Ave
Cohoes, NY 12047
$314,000B+
4 bd · 2.0 ba ·
2,251 sqft ·
Built 1949
· MultiFamily
· Pending
· 52 DOM
Cashflow @ list (25.0% down · 7.5%)
Estimated rent
$3,908/mo
Mortgage (P&I)
−$1,647
Tax + insurance
−$362
HOA
−$0
Vac / Maint / Mgmt
−$821
Net cashflow
$1,079/mo
Annual
$12,944/yr
Cap rate
10.42%
Cash-on-cash
14.72%
DSCR
1.66
1% rule
1.24%
Cash to close
$87,920
Investor read
- This is a 2 × 3-bed/1.0-bath units multifamily listed at $314k.
- At list price, monthly cash flow is $1k ($13k/yr) — positive. Per door: $539/mo.
- The deal already cash-flows at list — no discount required.
- Meets the 1% rule at list price ($4k rent vs $314k).
- It's been on market 52 days — a 3% lower offer ($305k) is reasonable based on typical stale-listing flexibility.
- Recommended offer: $305k (3.0% below list) — sets the bar for market timing.
- Local home prices are declining (-3.0%/yr); year-one equity from $2k of loan paydown is wiped out by about $9k of value loss. Plan a longer hold.
- Location reads 83/100 on livability (#61 in NY, #895 nationally) — a professional / high-income tenant draw. Strengths: amenities A+, commute A+, housing A+; Watch: employment C-.
- Cohoes City School District (suburban): math 38% / reading 48% proficiency, ranked #487 of 590 in NY (top 82%) — families likely to look elsewhere, expect single-tenant / working-renter base with shorter leases.
- Watch-outs: built in 1949 — expect roof / HVAC / electrical / plumbing capex.
- Market conditions: Rents rising fast (+7.6%/yr); 114 active listings in the ZIP; 3 comparable units currently listed for rent nearby; rentals at typical pace (median 19d on market — plan ~3-4 weeks tenant-placement turnaround); 675 units permitted in Albany County in 2024 (451 in 5+ unit buildings).
- Albany County population projected at +9% by 2050 — modest demand growth; plan on rents tracking national, not racing it.
- At projected returns (-3.0% appreciation + 7.6% rent growth), your $88k cash investment doubles in ~7 years — after that, you're playing with house money.
- Cap rate 10.4% vs local median 4.7% in Cohoes — top-decile yield for the area; either an underpriced asset or a hidden risk that comps aren't pricing in. Stress-test before assuming the spread holds.
- At $3,908/mo this rent would consume 71% of the median local household income ($66k/yr) (locally 1395% of renters already pay >50% of income on rent) — very limited rent-growth headroom before tenants either downsize or default.
Questions for listing agent
- It's been on market 52 days. Have you received any prior offers? Is the seller open to a 3% concession, seller financing, or rate buy-down credit?
- Can we see the unit-by-unit rent roll, current vacancy, and any below-market leases? What's the average tenancy length?
- What capital expenditures (roof, boiler, parking lot, exteriors) have been made in the last 5 years, and what's planned in the next 2?
- Built in 1949 — when were the roof, HVAC, electrical panel, plumbing, and water heater last replaced?
- Is there a deadline driving the sale (1031 exchange, divorce, estate, relocation)? That informs how much negotiation room exists.
- What's the average days-on-market for RENTAL listings here right now (not sales)? A rising rental-DOM trend means longer vacancies and softer asking-rent achievability than the comps imply.
- What's the recent tenant-quality profile in this submarket — average credit score on applications, eviction rate, late-payment / NSF rate, and stable-employment percentage? A property-management company in the area should have these aggregated.
- How much new apartment / multifamily construction is in the pipeline within 1–3 miles? Heavy new supply (>2% of stock underway) typically softens rents 12–24 months out; light construction supports rent growth.
CashFlowRE · CFR-3C2PB3C56SR2RF
· Data 1 week ago
cashflowre.app · 2026-05-29