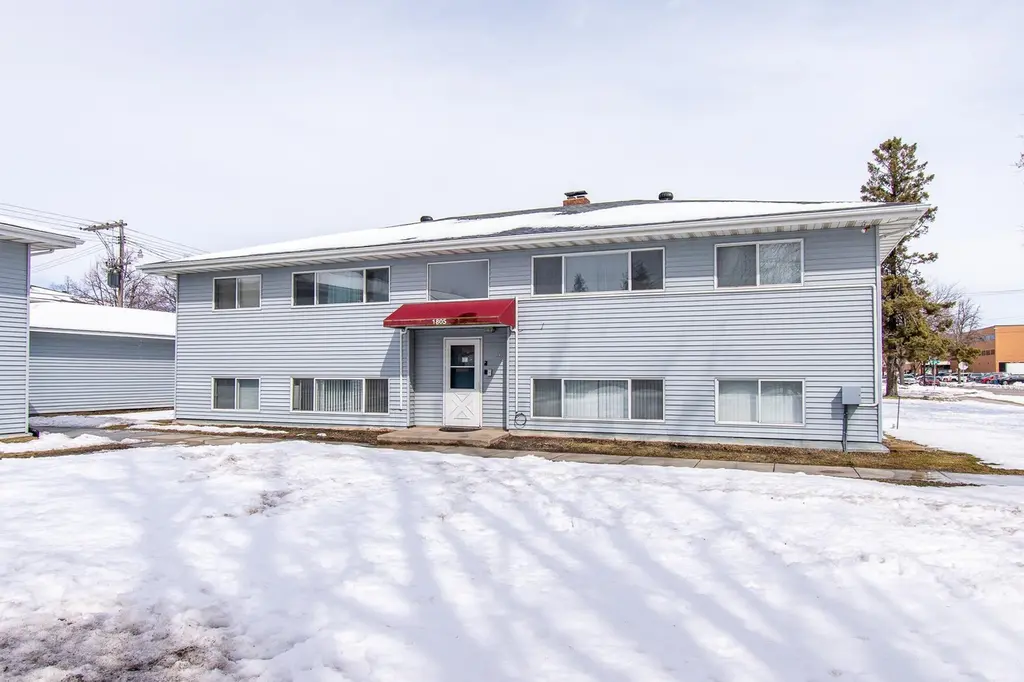
1805 13 1/2 St S
Fargo, ND 58103
$329,000F
9 bd · 3.9 ba ·
4,032 sqft ·
Built 1957
· MultiFamily
· Pending
· 12 DOM
Cashflow @ list (25.0% down · 7.5%)
Estimated rent
$2,356/mo
Mortgage (P&I)
−$1,725
Tax + insurance
−$527
HOA
−$0
Vac / Maint / Mgmt
−$495
Net cashflow
$-391/mo
Annual
$-4,687/yr
Cap rate
4.87%
Cash-on-cash
-5.09%
DSCR
0.77
1% rule
0.72%
Cash to close
$92,120
Investor read
- This is a 3 × 1-bed/1-bath units multifamily listed at $329k.
- At list price, monthly cash flow is $-391 ($-5k/yr) — negative. Per door: $-130/mo.
- To cash-flow at today's rent, offer at most $260k (21.0% below list).
- To meet the 1% rule (rent ≥ 1% of price), the offer needs to be $236k (28.4% below list).
- Only 12 days on market — expect competitive offers; lowballing is unlikely to land.
- Recommended offer: $236k (28.4% below list) — sets the bar for 1% rule.
- Local home prices are declining (-3.0%/yr); year-one equity from $2k of loan paydown is wiped out by about $10k of value loss. Plan a longer hold.
- Location reads 85/100 on livability (#1 in ND, #605 nationally) — a professional / high-income tenant draw. Strengths: amenities A+, commute A+, cost of living A+; Watch: crime F.
- Fargo 1 (urban): math 41% / reading 44% proficiency, ranked #28 of 53 in ND (top 53%) — families likely to look elsewhere, expect single-tenant / working-renter base with shorter leases.
- Watch-outs: built in 1957 — expect roof / HVAC / electrical / plumbing capex.
- Market conditions: Rents rising fast (+5.0%/yr); 208 active listings in the ZIP; 1,218 units permitted in Cass County in 2024 (410 in 5+ unit buildings).
- Cass County population projected at +69% by 2050 — long-run rental-demand tailwind backs the buy-and-hold thesis.
- 2 sale attempts with the ask held roughly flat each time — persistent listings suggest the price (not the market) is what's stuck; bring a comps-based counter.
- Cap rate 4.9% vs local median 2.5% in Fargo — top-decile yield for the area; either an underpriced asset or a hidden risk that comps aren't pricing in. Stress-test before assuming the spread holds.
- At $2,356/mo this rent would consume 48% of the median local household income ($59k/yr) (locally 1782% of renters already pay >50% of income on rent) — very limited rent-growth headroom before tenants either downsize or default.
Questions for listing agent
- What do current leases actually rent for vs. the listed asking? Can we see a recent rent roll and the last 12 months of T-12 income?
- Can we see the unit-by-unit rent roll, current vacancy, and any below-market leases? What's the average tenancy length?
- What capital expenditures (roof, boiler, parking lot, exteriors) have been made in the last 5 years, and what's planned in the next 2?
- Built in 1957 — when were the roof, HVAC, electrical panel, plumbing, and water heater last replaced?
- Is there a deadline driving the sale (1031 exchange, divorce, estate, relocation)? That informs how much negotiation room exists.
- Crime grade is F in this area — have there been break-ins, vandalism, or insurance claims at this property in the last 3 years? What carrier currently insures it and at what premium?
- The area grade is low — what's the realistic commute time and amenity access for the typical tenant pool here? Any planned neighborhood developments (good or bad) we should know about?
- What's the average days-on-market for RENTAL listings here right now (not sales)? A rising rental-DOM trend means longer vacancies and softer asking-rent achievability than the comps imply.
CashFlowRE · CFR-3CMB6V2WS0WXJ2
· Data 1 week ago
cashflowre.app · 2026-05-29