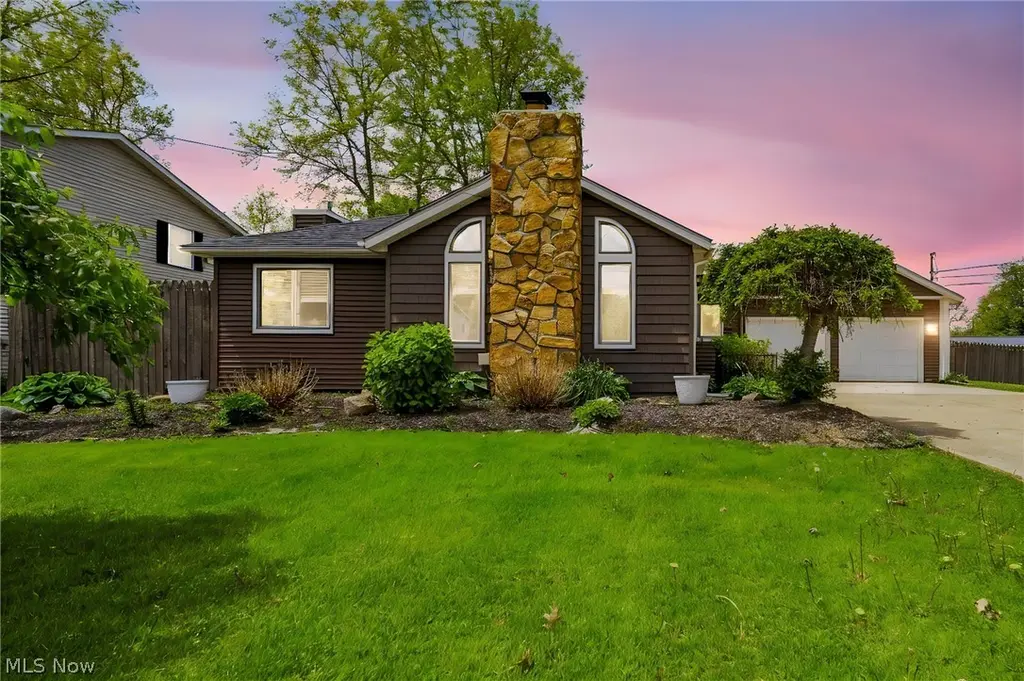
2013 Deerfield Dr
Ashtabula, OH 44004
$289,900C
3 bd · 3.0 ba ·
1,710 sqft ·
Built 1989
· SingleFamily
· Pending
· 4 DOM
Cashflow @ list (25.0% down · 7.5%)
Estimated rent
$3,749/mo
Mortgage (P&I)
−$1,520
Tax + insurance
−$460
HOA
−$0
Vac / Maint / Mgmt
−$787
Net cashflow
$981/mo
Annual
$11,773/yr
Cap rate
10.35%
Cash-on-cash
14.50%
DSCR
1.65
1% rule
1.29%
Cash to close
$81,172
Investor read
- This is a 3-bed/3.0-bath single-family listed at $290k.
- At list price, monthly cash flow is $981 ($12k/yr) — positive.
- The deal already cash-flows at list — no discount required.
- Meets the 1% rule at list price ($4k rent vs $290k).
- Only 4 days on market — expect competitive offers; lowballing is unlikely to land.
- Local home prices are declining (-3.0%/yr); year-one equity from $2k of loan paydown is wiped out by about $9k of value loss. Plan a longer hold.
- Location reads 71/100 on livability (#420 in OH) — a middle-class / working-renter tenant base. Strengths: cost of living A+, health & safety A+, housing A; Watch: amenities F, commute F, employment F.
- Ashtabula Area City (town): math 24% / reading 35% proficiency, ranked #588 of 656 in OH (top 90%) — low school quality limits family demand, transient renter base, plan for 1-2y turnover; 63% free/reduced lunch — lower-income household profile, screen leases tightly.
- Zoned schools: Superior Intermediate School (math 30% / reading 31%, grade F, #1,151 of 1,584 statewide, top 73%, 436 students, 0% FRL); Lakeside Junior High School (math 24% / reading 34%, grade F, #579 of 654 statewide, top 89%, 505 students, 0% FRL); Lakeside High School (math 12% / reading 37%, grade F, #644 of 781 statewide, top 85%, 894 students, 0% FRL) — zoned schools average 0% FRL vs 63% district-wide (63 pts lower); this property's tenant base skews higher-income than the district average.
- Market conditions: 172 active listings in the ZIP; 2 comparable units currently listed for rent nearby; 155 units permitted in Ashtabula County in 2024 (0 in 5+ unit buildings).
- Ashtabula County population projected at -22% by 2050 — secular population decline; favor cash flow + early exit over multi-decade hold.
- 4 sale attempts since 11y ago with the ask held roughly flat each time — persistent listings suggest the price (not the market) is what's stuck; bring a comps-based counter.
- At projected returns (-3.0% appreciation + 3.0% rent growth), your $81k cash investment doubles in ~9 years — after that, you're playing with house money.
- Cap rate 10.4% vs local median 8.3% in Ashtabula — meaningfully above typical; check what's discounted (condition, days-on-market, listing class) to confirm the premium yield is real.
- At $3,749/mo this rent would consume 91% of the median local household income ($50k/yr) — very limited rent-growth headroom before tenants either downsize or default.
Questions for listing agent
- Is there a deadline driving the sale (1031 exchange, divorce, estate, relocation)? That informs how much negotiation room exists.
- What's the average days-on-market for RENTAL listings here right now (not sales)? A rising rental-DOM trend means longer vacancies and softer asking-rent achievability than the comps imply.
- What's the recent tenant-quality profile in this submarket — average credit score on applications, eviction rate, late-payment / NSF rate, and stable-employment percentage? A property-management company in the area should have these aggregated.
- How much new for-sale + rental construction is in the pipeline within 1–3 miles? Heavy new supply typically softens prices + rents 12–24 months out; constrained supply supports both.
CashFlowRE · CFR-3DKRTH8ZT5T9B7
· Data 4 weeks ago
cashflowre.app · 2026-05-29