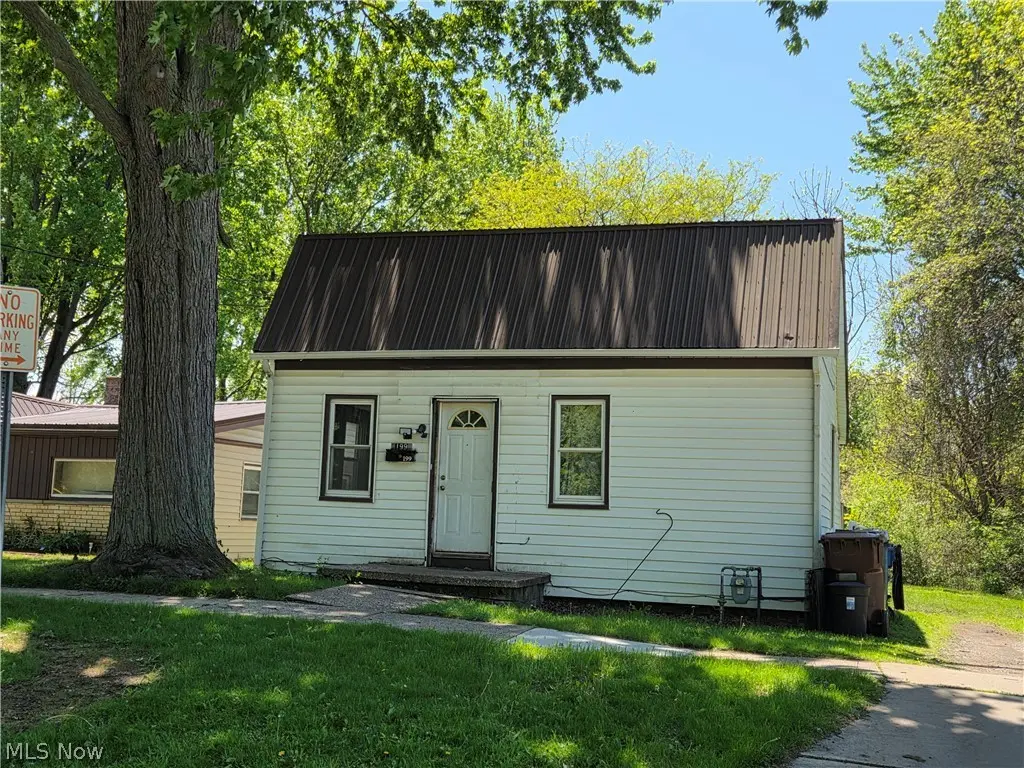
199 Mathews St
Painesville, OH 44077
$50,000B-
3 bd · 1.0 ba ·
850 sqft ·
Built 1930
· SingleFamily
· Pending
· 5 DOM
Cashflow @ list (25.0% down · 7.5%)
Estimated rent
$1,183/mo
Mortgage (P&I)
−$262
Tax + insurance
−$152
HOA
−$0
Vac / Maint / Mgmt
−$248
Net cashflow
$520/mo
Annual
$6,236/yr
Cap rate
18.76%
Cash-on-cash
44.54%
DSCR
2.98
1% rule
2.37%
Cash to close
$14,000
Investor read
- This is a 3-bed/1.0-bath single-family listed at $50k.
- At list price, monthly cash flow is $520 ($6k/yr) — positive.
- The deal already cash-flows at list — no discount required.
- Meets the 1% rule at list price ($1k rent vs $50k).
- Only 5 days on market — expect competitive offers; lowballing is unlikely to land.
- Local home prices are declining (-3.0%/yr); year-one equity from $346 of loan paydown is wiped out by about $2k of value loss. Plan a longer hold.
- Location reads 72/100 on livability (#360 in OH) — a middle-class / working-renter tenant base. Strengths: cost of living A+, housing A+, health & safety A+; Watch: employment D+, amenities F, commute F.
- Painesville City Local (suburban): math 28% / reading 35% proficiency, ranked #577 of 656 in OH (top 88%) — families likely to look elsewhere, expect single-tenant / working-renter base with shorter leases; 76% free/reduced lunch — lower-income household profile, screen leases tightly.
- Watch-outs: property tax is 3.2% of price; built in 1930 — expect roof / HVAC / electrical / plumbing capex.
- Market conditions: Rents rising (+3.7%/yr); 267 active listings in the ZIP; 6 comparable units currently listed for rent nearby; rentals lingering (median 44d on market — plan ~5-8 weeks vacancy on turnover, expect pricing pressure); 67% of comp listings sitting > 30 days — soft ceiling on asking rent; solid renter incomes; 448 units permitted in Lake County in 2024 (0 in 5+ unit buildings).
- Lake County population projected to shrink 8% by 2050 — rents likely to lag national; underwrite the cash flow, not the appreciation.
- At projected returns (-3.0% appreciation + 3.7% rent growth), your $14k cash investment doubles in ~3 years — after that, you're playing with house money.
- Cap rate 18.8% vs local median 2.9% in Painesville — top-decile yield for the area; either an underpriced asset or a hidden risk that comps aren't pricing in. Stress-test before assuming the spread holds.
- This rent is only 17% of the median local income ($85k/yr) — well below the 30% rent-burden line; pricing power to push rent on renewal without tenant pushback.
Questions for listing agent
- Built in 1930 — when were the roof, HVAC, electrical panel, plumbing, and water heater last replaced?
- Property tax is high relative to price — has the assessment been appealed recently, and will the sale trigger a re-assessment?
- Is there a deadline driving the sale (1031 exchange, divorce, estate, relocation)? That informs how much negotiation room exists.
- What's the average days-on-market for RENTAL listings here right now (not sales)? A rising rental-DOM trend means longer vacancies and softer asking-rent achievability than the comps imply.
- What's the recent tenant-quality profile in this submarket — average credit score on applications, eviction rate, late-payment / NSF rate, and stable-employment percentage? A property-management company in the area should have these aggregated.
- How much new for-sale + rental construction is in the pipeline within 1–3 miles? Heavy new supply typically softens prices + rents 12–24 months out; constrained supply supports both.
CashFlowRE · CFR-3EZ57HE674Z5PR
· Data 3 weeks ago
cashflowre.app · 2026-05-29