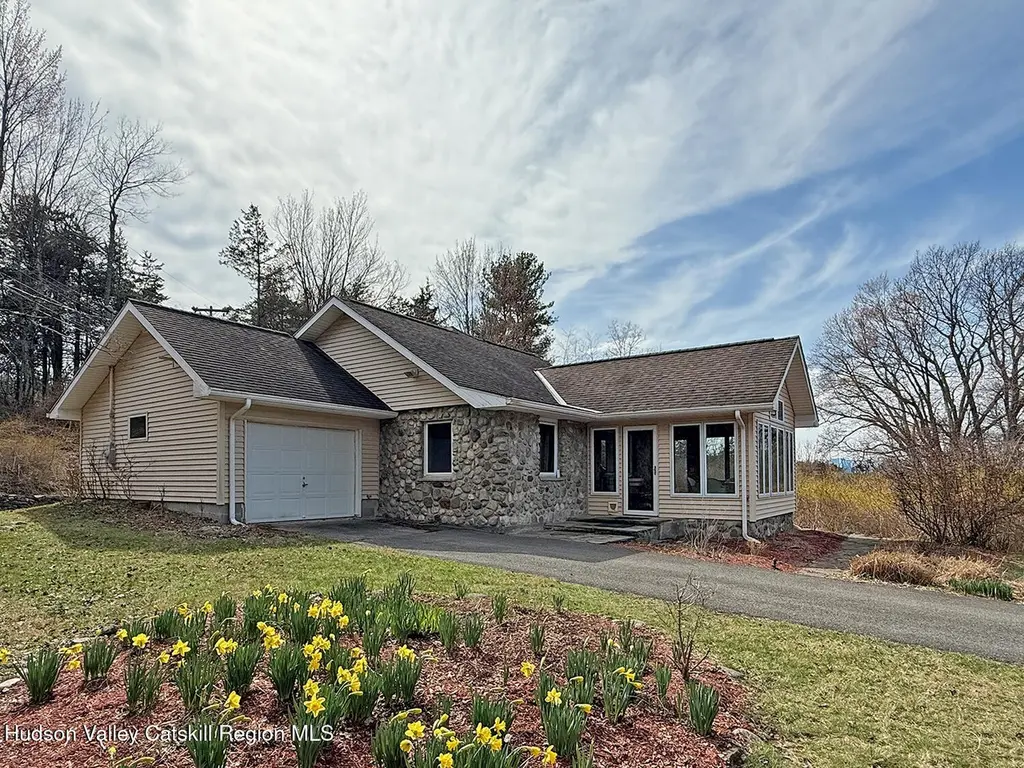
335 Miller Rd
Claverack-Red Mills, NY 12534
$595,000D
3 bd · 2.0 ba ·
1,870 sqft ·
Built 1948
· SingleFamily
· Pending
· 27 DOM
Cashflow @ list (25.0% down · 7.5%)
Estimated rent
$2,650/mo
Mortgage (P&I)
−$3,120
Tax + insurance
−$992
HOA
−$0
Vac / Maint / Mgmt
−$557
Net cashflow
$-2,018/mo
Annual
$-24,219/yr
Cap rate
2.22%
Cash-on-cash
-14.54%
DSCR
0.35
1% rule
0.45%
Cash to close
$166,600
Investor read
- This is a 3-bed/2.0-bath single-family listed at $595k.
- At list price, monthly cash flow is $-2k ($-24k/yr) — negative.
- To cash-flow at today's rent, offer at most $303k (49.1% below list).
- To meet the 1% rule (rent ≥ 1% of price), the offer needs to be $265k (55.5% below list).
- It's been on market 27 days — a 2% lower offer ($586k) is reasonable based on typical stale-listing flexibility.
- Recommended offer: $265k (55.5% below list) — sets the bar for 1% rule.
- In year one you build about $64k of equity ($4k loan paydown + $60k appreciation (10.0% local appreciation)).
- Location reads: area grade D — affects rentability + tenant quality, not the cash-flow math above.
- Taconic Hills Central School District (rural): math 53% / reading 51% proficiency, ranked #335 of 590 in NY (top 57%) — acceptable for families but not a draw, mixed tenant base, ~2y average lease.
- Zoned schools: Taconic Hills Elementary School (math 53% / reading 50%, grade C-, #1,041 of 2,108 statewide, top 50%, 562 students, 57% FRL); Taconic Hillsjunior/Senior High School (math 52% / reading 52%, grade D+, #946 of 1,100 statewide, top 88%, 502 students, 45% FRL).
- Watch-outs: built in 1948 — expect roof / HVAC / electrical / plumbing capex.
- Market conditions: Rents rising fast (+10.9%/yr); 162 active listings in the ZIP; 136 units permitted in Columbia County in 2024 (0 in 5+ unit buildings).
- Columbia County population projected at -22% by 2050 — secular population decline; favor cash flow + early exit over multi-decade hold.
- 2 sale attempts with the ask held roughly flat each time — persistent listings suggest the price (not the market) is what's stuck; bring a comps-based counter.
- By year 2, paydown + projected appreciation supports a ~$102k cash-out refi (75% LTV) — recoverable capital for the next deal without selling this one.
- Cap rate 2.2% vs local median 3.9% in Claverack-Red Mills — below-typical yield; the buyer is paying a premium for something (appreciation thesis, condition, location) that the cap rate doesn't capture.
- This rent runs 44% of the median local income ($73k/yr) — at the standard rent-burdened threshold; future hikes will face affordability resistance.
Questions for listing agent
- What do current leases actually rent for vs. the listed asking? Can we see a recent rent roll and the last 12 months of T-12 income?
- Built in 1948 — when were the roof, HVAC, electrical panel, plumbing, and water heater last replaced?
- Is there a deadline driving the sale (1031 exchange, divorce, estate, relocation)? That informs how much negotiation room exists.
- The area grade is low — what's the realistic commute time and amenity access for the typical tenant pool here? Any planned neighborhood developments (good or bad) we should know about?
- What's the average days-on-market for RENTAL listings here right now (not sales)? A rising rental-DOM trend means longer vacancies and softer asking-rent achievability than the comps imply.
- What's the recent tenant-quality profile in this submarket — average credit score on applications, eviction rate, late-payment / NSF rate, and stable-employment percentage? A property-management company in the area should have these aggregated.
- How much new for-sale + rental construction is in the pipeline within 1–3 miles? Heavy new supply typically softens prices + rents 12–24 months out; constrained supply supports both.
CashFlowRE · CFR-3F2RA1FM0AS79N
· Data 4 weeks ago
cashflowre.app · 2026-05-29