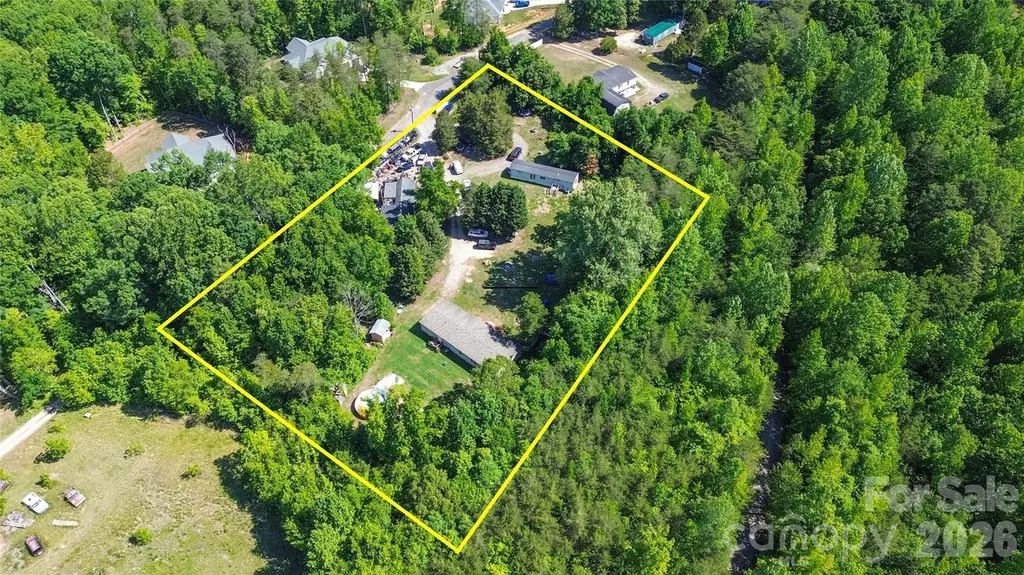
5595 American Way
Denver, NC 28037
$350,000B-
8 bd · 4.0 ba ·
3,435 sqft ·
Built 2018
· MultiFamily
· Active
· 34 DOM
Cashflow @ list (25.0% down · 7.5%)
Estimated rent
$4,442/mo
Mortgage (P&I)
−$1,835
Tax + insurance
−$583
HOA
−$0
Vac / Maint / Mgmt
−$933
Net cashflow
$1,090/mo
Annual
$13,085/yr
Cap rate
10.03%
Cash-on-cash
13.35%
DSCR
1.59
1% rule
1.27%
Cash to close
$98,000
Investor read
- This is a 2 × 4-bed/?-bath units multifamily listed at $350k.
- At list price, monthly cash flow is $1k ($13k/yr) — positive. Per door: $545/mo.
- The deal already cash-flows at list — no discount required.
- Meets the 1% rule at list price ($4k rent vs $350k).
- It's been on market 34 days — a 3% lower offer ($340k) is reasonable based on typical stale-listing flexibility.
- Recommended offer: $340k (3.0% below list) — sets the bar for market timing.
- Local home prices are declining (-3.0%/yr); year-one equity from $2k of loan paydown is wiped out by about $10k of value loss. Plan a longer hold.
- Location reads 66/100 on livability (#255 in NC) — a middle-class / working-renter tenant base. Strengths: crime A+, cost of living A+, housing B+; Watch: employment D, amenities F, commute F.
- Lincoln County Schools (rural): math 57% / reading 55% proficiency, ranked #42 of 178 in NC (top 24%) — acceptable for families but not a draw, mixed tenant base, ~2y average lease.
- Market conditions: Rents soft (-0.3%/yr); 373 active listings in the ZIP; high-income renter base; 697 units permitted in Lincoln County in 2024 (0 in 5+ unit buildings).
- Lincoln County population projected at +8% by 2050 — modest demand growth; plan on rents tracking national, not racing it.
- 3 sale attempts since 10y ago with the ask held roughly flat each time — persistent listings suggest the price (not the market) is what's stuck; bring a comps-based counter.
- Current owner paid $48k; list at $350k implies a 637% gain — meaningful room to come down on a strong offer.
- Climate carrying-cost: extreme-heat days projected 7→17/yr by 2055 (HVAC capex compounding) — expect insurance premiums to compound above CPI over the hold.
- Cap rate 10.0% vs local median 2.1% in Denver — top-decile yield for the area; either an underpriced asset or a hidden risk that comps aren't pricing in. Stress-test before assuming the spread holds.
- At $4,442/mo this rent would consume 48% of the median local household income ($112k/yr) (locally 546% of renters already pay >50% of income on rent) — very limited rent-growth headroom before tenants either downsize or default.
Questions for listing agent
- It's been on market 34 days. Have you received any prior offers? Is the seller open to a 3% concession, seller financing, or rate buy-down credit?
- Can we see the unit-by-unit rent roll, current vacancy, and any below-market leases? What's the average tenancy length?
- What capital expenditures (roof, boiler, parking lot, exteriors) have been made in the last 5 years, and what's planned in the next 2?
- Is there a deadline driving the sale (1031 exchange, divorce, estate, relocation)? That informs how much negotiation room exists.
- Schools are B-rated — typically a magnet for longer-tenancy family renters. What's the average tenant stay here, and is there a school-zone premium baked into asking?
- What's the average days-on-market for RENTAL listings here right now (not sales)? A rising rental-DOM trend means longer vacancies and softer asking-rent achievability than the comps imply.
- What's the recent tenant-quality profile in this submarket — average credit score on applications, eviction rate, late-payment / NSF rate, and stable-employment percentage? A property-management company in the area should have these aggregated.
- How much new apartment / multifamily construction is in the pipeline within 1–3 miles? Heavy new supply (>2% of stock underway) typically softens rents 12–24 months out; light construction supports rent growth.
CashFlowRE · CFR-3FY7GH3X7CS0RK
· Data 2 days ago
cashflowre.app · 2026-05-29