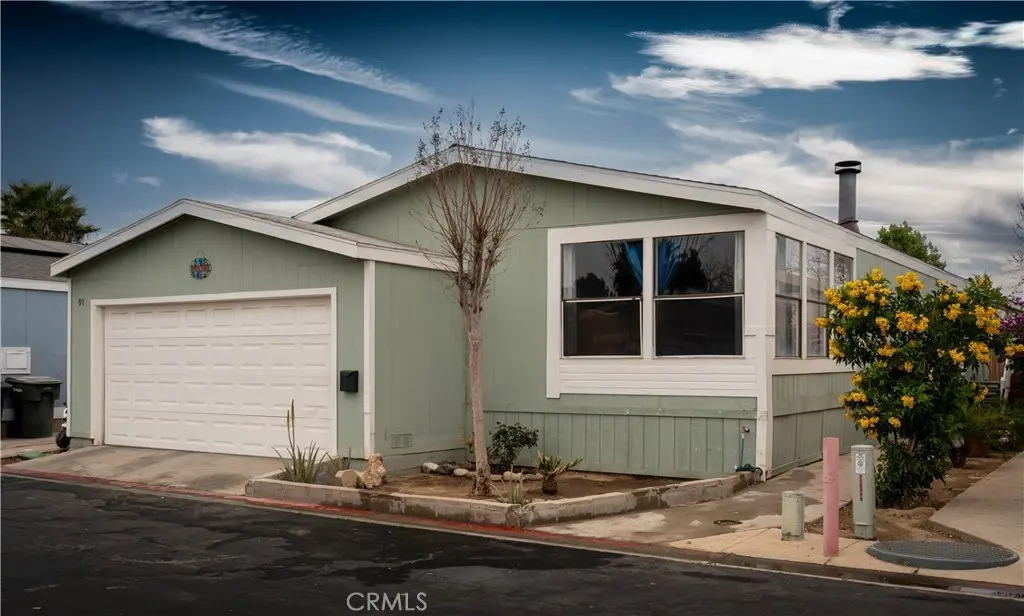
80 E Dawes #97
Perris, CA 92571
$185,000B-
3 bd · 2.0 ba ·
1,484 sqft ·
Built 1988
· Manufactured
· Active
· 117 DOM
Cashflow @ list (25.0% down · 7.5%)
Estimated rent
$3,216/mo
Mortgage (P&I)
−$970
Tax + insurance
−$308
HOA
−$0
Vac / Maint / Mgmt
−$675
Net cashflow
$1,262/mo
Annual
$15,148/yr
Cap rate
14.48%
Cash-on-cash
29.24%
DSCR
2.30
1% rule
1.74%
Cash to close
$51,800
Investor read
- This is a 3-bed/2.0-bath manufactured listed at $185k. Condition is rated fair.
- At list price, monthly cash flow is $1k ($15k/yr) — positive.
- The deal already cash-flows at list — no discount required.
- Meets the 1% rule at list price ($3k rent vs $185k).
- It's been on market 117 days — a 9% lower offer ($168k) is reasonable based on typical stale-listing flexibility.
- Recommended offer: $168k (9.0% below list) — sets the bar for market timing.
- Local home prices are declining (-3.0%/yr); year-one equity from $1k of loan paydown is wiped out by about $6k of value loss. Plan a longer hold.
- Location reads 67/100 on livability (#322 in CA) — a middle-class / working-renter tenant base. Strengths: housing A+, commute B; Watch: crime C-, health & safety D, schools F.
- Val Verde Unified (suburban): math 28% / reading 44% proficiency, ranked #820 of 1,400 in CA (top 59%) — families likely to look elsewhere, expect single-tenant / working-renter base with shorter leases; 66% free/reduced lunch — lower-income household profile, screen leases tightly.
- Market conditions: Rents rising fast (+7.7%/yr); 136 active listings in the ZIP; solid renter incomes; 9,195 units permitted in Riverside County in 2024 (1,512 in 5+ unit buildings).
- Riverside County population projected at +22% by 2050 — long-run rental-demand tailwind backs the buy-and-hold thesis.
- 6 sale attempts since 21y ago with the ask held roughly flat each time — persistent listings suggest the price (not the market) is what's stuck; bring a comps-based counter.
- At projected returns (-3.0% appreciation + 7.7% rent growth), your $52k cash investment doubles in ~4 years — after that, you're playing with house money.
- Climate carrying-cost: extreme-heat days projected 7→20/yr by 2055 (HVAC capex compounding) — expect insurance premiums to compound above CPI over the hold.
- Cap rate 14.5% vs local median 3.7% in Perris — top-decile yield for the area; either an underpriced asset or a hidden risk that comps aren't pricing in. Stress-test before assuming the spread holds.
- This rent runs 42% of the median local income ($92k/yr) — at the standard rent-burdened threshold; future hikes will face affordability resistance.
Questions for listing agent
- It's been on market 117 days. Have you received any prior offers? Is the seller open to a 9% concession, seller financing, or rate buy-down credit?
- Have any recent inspections been done? Can we get a copy of the seller's disclosures and any deferred-maintenance estimates?
- Why hasn't it sold? Are there any deal-killer items the seller is aware of (foundation, flood, title, zoning, code violations)?
- Is there a deadline driving the sale (1031 exchange, divorce, estate, relocation)? That informs how much negotiation room exists.
- Schools are F-rated, which usually means shorter tenancies and higher turnover. Who's the typical renter profile here, and what's been the actual vacancy rate?
- What's the average days-on-market for RENTAL listings here right now (not sales)? A rising rental-DOM trend means longer vacancies and softer asking-rent achievability than the comps imply.
- What's the recent tenant-quality profile in this submarket — average credit score on applications, eviction rate, late-payment / NSF rate, and stable-employment percentage? A property-management company in the area should have these aggregated.
- How much new for-sale + rental construction is in the pipeline within 1–3 miles? Heavy new supply typically softens prices + rents 12–24 months out; constrained supply supports both.
Repairs flagged (vision-AI assessment)
- Minor: Exterior paint — Light wear
- Minor: Landscaping — Some overgrown plants
CashFlowRE · CFR-3GC5DVCZRJ0WWP
· Data 2 days ago
cashflowre.app · 2026-05-29