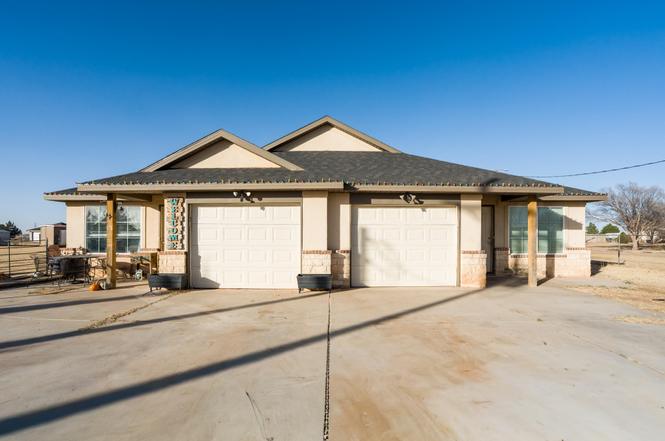
2330 F M 1294 Unit A & B
Lubbock, TX 79403
$270,000C-
6 bd · 4.0 ba ·
3,034 sqft ·
Built 2021
· MultiFamily
· Pending
· 5 DOM
Cashflow @ list (25.0% down · 7.5%)
Estimated rent
$2,713/mo
Mortgage (P&I)
−$1,416
Tax + insurance
−$516
HOA
−$0
Vac / Maint / Mgmt
−$570
Net cashflow
$211/mo
Annual
$2,531/yr
Cap rate
7.53%
Cash-on-cash
4.40%
DSCR
1.20
1% rule
1.00%
Cash to close
$75,600
Investor read
- This is a 2 × 3-bed/2.0-bath units multifamily listed at $270k.
- At list price, monthly cash flow is $211 ($3k/yr) — positive. Per door: $105/mo.
- The deal already cash-flows at list — no discount required.
- Meets the 1% rule at list price ($3k rent vs $270k).
- Only 5 days on market — expect competitive offers; lowballing is unlikely to land.
- Local home prices are declining (-3.0%/yr); year-one equity from $2k of loan paydown is wiped out by about $8k of value loss. Plan a longer hold.
- Location reads 80/100 on livability (#37 in TX, #1,749 nationally) — a professional / high-income tenant draw. Strengths: commute A+, cost of living A+, housing A+; Watch: employment C-, crime F.
- New Deal ISD (rural): math 39% / reading 43% proficiency, ranked #368 of 826 in TX (top 45%) — families likely to look elsewhere, expect single-tenant / working-renter base with shorter leases.
- Zoned schools: New Deal El (math 32% / reading 37%, grade F, #1,995 of 4,322 statewide, top 50%, 275 students, 73% FRL); New Deal Middle (math 38% / reading 40%, grade F, #690 of 1,662 statewide, top 42%, 235 students, 72% FRL); New Deal H S (math 57% / reading 64%, grade C+, #265 of 1,632 statewide, top 16%, 244 students, 68% FRL) — zoned schools average 71% FRL vs 53% district-wide (18 pts higher); higher-poverty schools than district average — tighter screening recommended.
- Watch-outs: flood insurance adds $66/mo.
- Market conditions: Rents rising (+1.5%/yr); 165 active listings in the ZIP; 2,219 units permitted in Lubbock County in 2024 (252 in 5+ unit buildings).
- Lubbock County population projected at +39% by 2050 — long-run rental-demand tailwind backs the buy-and-hold thesis.
- Climate carrying-cost: major flood risk; major wildfire risk; extreme-heat days projected 7→21/yr by 2055 (HVAC capex compounding) — expect insurance premiums to compound above CPI over the hold.
- At $2,713/mo this rent would consume 68% of the median local household income ($48k/yr) (locally 612% of renters already pay >50% of income on rent) — very limited rent-growth headroom before tenants either downsize or default.
Questions for listing agent
- Can we see the unit-by-unit rent roll, current vacancy, and any below-market leases? What's the average tenancy length?
- What capital expenditures (roof, boiler, parking lot, exteriors) have been made in the last 5 years, and what's planned in the next 2?
- What's the actual annual flood-insurance premium (NFIP or private), and is the property in a SFHA with mandatory coverage?
- Is there a deadline driving the sale (1031 exchange, divorce, estate, relocation)? That informs how much negotiation room exists.
- Schools are D-rated, which usually means shorter tenancies and higher turnover. Who's the typical renter profile here, and what's been the actual vacancy rate?
- Crime grade is F in this area — have there been break-ins, vandalism, or insurance claims at this property in the last 3 years? What carrier currently insures it and at what premium?
- What's the average days-on-market for RENTAL listings here right now (not sales)? A rising rental-DOM trend means longer vacancies and softer asking-rent achievability than the comps imply.
- What's the recent tenant-quality profile in this submarket — average credit score on applications, eviction rate, late-payment / NSF rate, and stable-employment percentage? A property-management company in the area should have these aggregated.
CashFlowRE · CFR-3HBAXH2FNABTWP
· Data 3 weeks ago
cashflowre.app · 2026-05-29