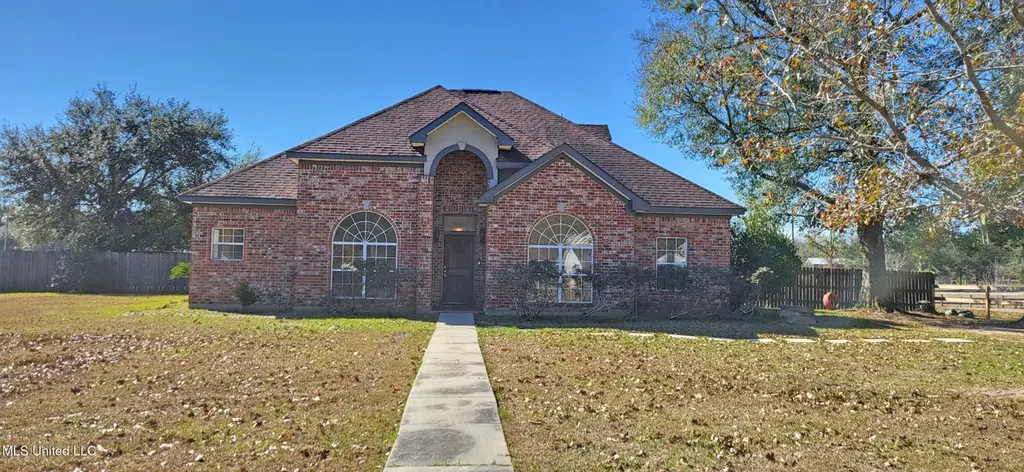
17139 Fenton Dedeaux Rd
Diamondhead, MS 39556
$229,900D-
3 bd · 3.0 ba ·
1,724 sqft ·
Built 2006
· SingleFamily
· Pending
· 109 DOM
Cashflow @ list (25.0% down · 7.5%)
Estimated rent
$1,531/mo
Mortgage (P&I)
−$1,206
Tax + insurance
−$248
HOA
−$0
Vac / Maint / Mgmt
−$321
Net cashflow
$-244/mo
Annual
$-2,928/yr
Cap rate
5.02%
Cash-on-cash
-4.55%
DSCR
0.80
1% rule
0.67%
Cash to close
$64,372
Investor read
- This is a 3-bed/3.0-bath single-family listed at $230k.
- At list price, monthly cash flow is $-244 ($-3k/yr) — negative.
- To cash-flow at today's rent, offer at most $187k (18.7% below list).
- To meet the 1% rule (rent ≥ 1% of price), the offer needs to be $153k (33.4% below list).
- It's been on market 109 days — a 9% lower offer ($209k) is reasonable based on typical stale-listing flexibility.
- Recommended offer: $153k (33.4% below list) — sets the bar for 1% rule.
- Local home prices are declining (-3.0%/yr); year-one equity from $2k of loan paydown is wiped out by about $7k of value loss. Plan a longer hold.
- Location reads 68/100 on livability (#59 in MS) — a middle-class / working-renter tenant base. Strengths: crime A+, cost of living A+, housing A+; Watch: amenities F, commute F, health & safety F.
- Hancock County School District (rural): math 47% / reading 44% proficiency, ranked #23 of 130 in MS (top 18%) — families likely to look elsewhere, expect single-tenant / working-renter base with shorter leases.
- Zoned schools: East Hancock Elementary School (math 64% / reading 59%, grade B, #22 of 375 statewide, top 6%, 639 students, 100% FRL); Hancock Middle School (math 48% / reading 44%, grade D+, #39 of 179 statewide, top 22%, 958 students, 100% FRL); Hancock High School (math 42% / reading 43%, grade F, #42 of 197 statewide, top 21%, 1,187 students, 100% FRL) — zoned schools average 100% FRL vs 58% district-wide (41 pts higher); higher-poverty schools than district average — tighter screening recommended.
- Market conditions: 141 active listings in the ZIP; 248 units permitted in Hancock County in 2024 (0 in 5+ unit buildings).
- Hancock County population projected at +20% by 2050 — long-run rental-demand tailwind backs the buy-and-hold thesis.
- 4 sale attempts since 20y ago; this cycle's ask has dropped $20k (8%) from the opening price — seller is motivated, your offer sets the floor, not the list.
- Climate carrying-cost: severe wind risk, 99% chance of damaging wind over 30y; moderate wildfire risk; extreme-heat days projected 7→21/yr by 2055 (HVAC capex compounding) — expect insurance premiums to compound above CPI over the hold.
Questions for listing agent
- What do current leases actually rent for vs. the listed asking? Can we see a recent rent roll and the last 12 months of T-12 income?
- It's been on market 109 days. Have you received any prior offers? Is the seller open to a 33% concession, seller financing, or rate buy-down credit?
- Why hasn't it sold? Are there any deal-killer items the seller is aware of (foundation, flood, title, zoning, code violations)?
- Is there a deadline driving the sale (1031 exchange, divorce, estate, relocation)? That informs how much negotiation room exists.
- The area grade is low — what's the realistic commute time and amenity access for the typical tenant pool here? Any planned neighborhood developments (good or bad) we should know about?
- What's the average days-on-market for RENTAL listings here right now (not sales)? A rising rental-DOM trend means longer vacancies and softer asking-rent achievability than the comps imply.
- What's the recent tenant-quality profile in this submarket — average credit score on applications, eviction rate, late-payment / NSF rate, and stable-employment percentage? A property-management company in the area should have these aggregated.
- How much new for-sale + rental construction is in the pipeline within 1–3 miles? Heavy new supply typically softens prices + rents 12–24 months out; constrained supply supports both.
CashFlowRE · CFR-3J8E5S951HY9EN
· Data 3 weeks ago
cashflowre.app · 2026-05-29