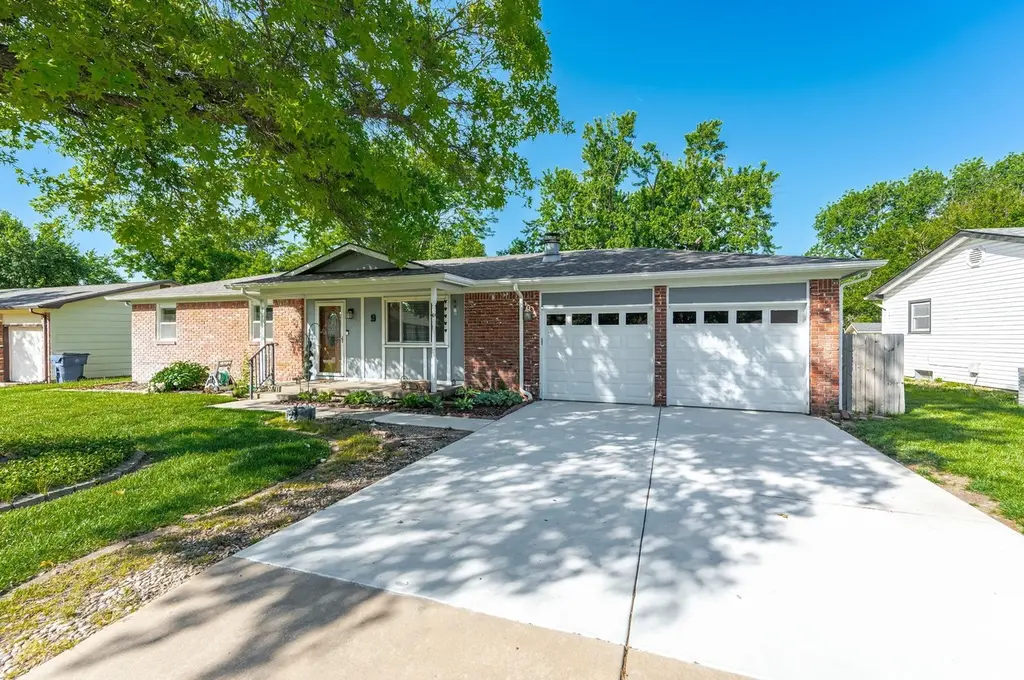
9 Argon Dr
Goddard, KS 67052
$230,000D
3 bd · 2.0 ba ·
1,848 sqft ·
Built 1974
· SingleFamily
· Pending
· 1 DOM
Cashflow @ list (25.0% down · 7.5%)
Estimated rent
$1,926/mo
Mortgage (P&I)
−$1,206
Tax + insurance
−$320
HOA
−$0
Vac / Maint / Mgmt
−$404
Net cashflow
$-4/mo
Annual
$-54/yr
Cap rate
6.27%
Cash-on-cash
-0.08%
DSCR
1.00
1% rule
0.84%
Cash to close
$64,400
Investor read
- This is a 3-bed/2.0-bath single-family listed at $230k.
- At list price, monthly cash flow is $-4 ($-54/yr) — negative.
- To cash-flow at today's rent, offer at most $229k (0.3% below list).
- To meet the 1% rule (rent ≥ 1% of price), the offer needs to be $193k (16.3% below list).
- Only 1 days on market — expect competitive offers; lowballing is unlikely to land.
- Recommended offer: $193k (16.3% below list) — sets the bar for 1% rule.
- Local home prices are declining (-3.0%/yr); year-one equity from $2k of loan paydown is wiped out by about $7k of value loss. Plan a longer hold.
- Location reads 73/100 on livability (#91 in KS) — a middle-class / working-renter tenant base. Strengths: crime A+, employment A+, cost of living A+; Watch: amenities F, commute F, health & safety F.
- Goddard (rural): math 38% / reading 46% proficiency, ranked #18 of 169 in KS (top 11%) — families likely to look elsewhere, expect single-tenant / working-renter base with shorter leases; only 17% free/reduced lunch — higher-income household profile.
- Zoned schools: Clark Davidson Elem (math 47% / reading 52%, grade D, #165 of 684 statewide, top 28%, 424 students, 36% FRL); Goddard Middle School (math 26% / reading 32%, grade F, #85 of 219 statewide, top 40%, 493 students, 30% FRL); Goddard High (math 22% / reading 27%, grade F, #105 of 327 statewide, top 49%, 948 students, 31% FRL) — zoned schools average 32% FRL vs 17% district-wide (15 pts higher); higher-poverty schools than district average — tighter screening recommended.
- Market conditions: 407 active listings in the ZIP; solid renter incomes; 2,613 units permitted in Sedgwick County in 2024 (258 in 5+ unit buildings).
- Sedgwick County population projected at +5% by 2050 — modest demand growth; plan on rents tracking national, not racing it.
- Climate carrying-cost: extreme-heat days projected 7→18/yr by 2055 (HVAC capex compounding) — expect insurance premiums to compound above CPI over the hold.
Questions for listing agent
- What do current leases actually rent for vs. the listed asking? Can we see a recent rent roll and the last 12 months of T-12 income?
- Built in 1974 — when were the roof, HVAC, electrical panel, plumbing, and water heater last replaced?
- Is there a deadline driving the sale (1031 exchange, divorce, estate, relocation)? That informs how much negotiation room exists.
- The area grade is low — what's the realistic commute time and amenity access for the typical tenant pool here? Any planned neighborhood developments (good or bad) we should know about?
- What's the average days-on-market for RENTAL listings here right now (not sales)? A rising rental-DOM trend means longer vacancies and softer asking-rent achievability than the comps imply.
- What's the recent tenant-quality profile in this submarket — average credit score on applications, eviction rate, late-payment / NSF rate, and stable-employment percentage? A property-management company in the area should have these aggregated.
- How much new for-sale + rental construction is in the pipeline within 1–3 miles? Heavy new supply typically softens prices + rents 12–24 months out; constrained supply supports both.
CashFlowRE · CFR-3KAPV13WF2KT7N
· Data 3 weeks ago
cashflowre.app · 2026-05-29