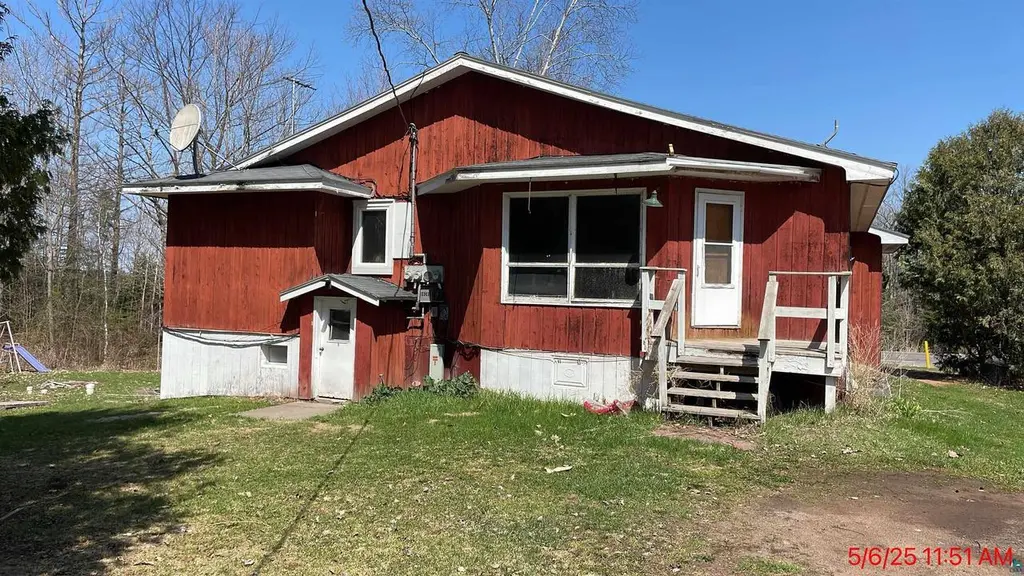
6407 S Tuff Rd
Superior, WI 54880
$135,000D
28 bd · 16.0 ba ·
— sqft ·
Built 1923
· MultiFamily
· Active
· 307 DOM
Cashflow @ list (25.0% down · 7.5%)
Estimated rent
$9,685/mo
Mortgage (P&I)
−$708
Tax + insurance
−$225
HOA
−$0
Vac / Maint / Mgmt
−$2,034
Net cashflow
$6,718/mo
Annual
$80,618/yr
Cap rate
66.01%
Cash-on-cash
213.28%
DSCR
10.49
1% rule
7.17%
Cash to close
$37,800
Investor read
- This is a 4 × 7-bed/4.0-bath units multifamily listed at $135k.
- At list price, monthly cash flow is $7k ($81k/yr) — positive. Per door: $2k/mo.
- The deal already cash-flows at list — no discount required.
- Meets the 1% rule at list price ($10k rent vs $135k).
- It's been on market 307 days — a 12% lower offer ($119k) is reasonable based on typical stale-listing flexibility.
- Recommended offer: $119k (12.0% below list) — sets the bar for market timing.
- Local home prices are declining (-3.0%/yr); year-one equity from $933 of loan paydown is wiped out by about $4k of value loss. Plan a longer hold.
- Location reads 86/100 on livability (#21 in WI, #337 nationally) — a professional / high-income tenant draw. Strengths: amenities A+, commute A+, cost of living A+; Watch: schools C-.
- Superior School District (suburban): math 23% / reading 34% proficiency, ranked #290 of 342 in WI (top 85%) — low school quality limits family demand, transient renter base, plan for 1-2y turnover.
- Watch-outs: built in 1923 — expect roof / HVAC / electrical / plumbing capex.
- Market conditions: Rents rising (+2.8%/yr); 168 active listings in the ZIP; 110 units permitted in Douglas County in 2024 (0 in 5+ unit buildings).
- Douglas County population projected at -20% by 2050 — secular population decline; favor cash flow + early exit over multi-decade hold.
- 2 sale attempts; this cycle's ask has dropped $25k (16%) from the opening price — seller is motivated, your offer sets the floor, not the list.
- At projected returns (-3.0% appreciation + 2.8% rent growth), your $38k cash investment doubles in ~1 year — after that, you're playing with house money.
- Cap rate 66.0% vs local median 4.6% in Superior — top-decile yield for the area; either an underpriced asset or a hidden risk that comps aren't pricing in. Stress-test before assuming the spread holds.
- At $9,685/mo this rent would consume 170% of the median local household income ($68k/yr) (locally 1018% of renters already pay >50% of income on rent) — very limited rent-growth headroom before tenants either downsize or default.
Questions for listing agent
- It's been on market 307 days. Have you received any prior offers? Is the seller open to a 12% concession, seller financing, or rate buy-down credit?
- Can we see the unit-by-unit rent roll, current vacancy, and any below-market leases? What's the average tenancy length?
- What capital expenditures (roof, boiler, parking lot, exteriors) have been made in the last 5 years, and what's planned in the next 2?
- Built in 1923 — when were the roof, HVAC, electrical panel, plumbing, and water heater last replaced?
- Why hasn't it sold? Are there any deal-killer items the seller is aware of (foundation, flood, title, zoning, code violations)?
- Is there a deadline driving the sale (1031 exchange, divorce, estate, relocation)? That informs how much negotiation room exists.
- The area grade is low — what's the realistic commute time and amenity access for the typical tenant pool here? Any planned neighborhood developments (good or bad) we should know about?
- What's the average days-on-market for RENTAL listings here right now (not sales)? A rising rental-DOM trend means longer vacancies and softer asking-rent achievability than the comps imply.
CashFlowRE · CFR-3MD0HV0QF4CCN5
· Data 2 days ago
cashflowre.app · 2026-05-29