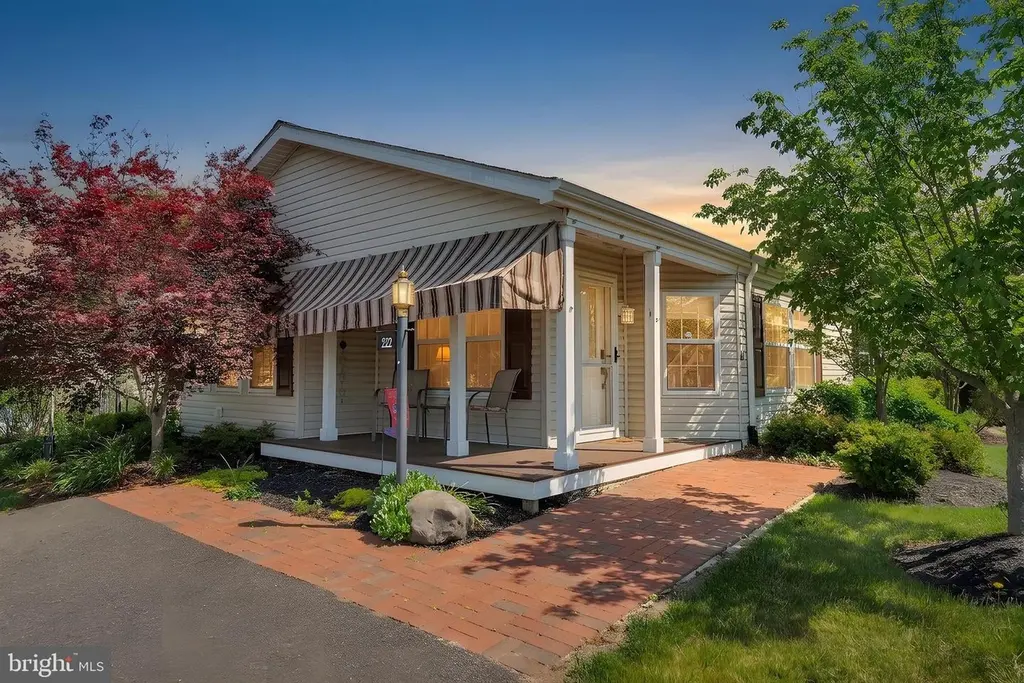
222 Thrush Cir
Richboro, PA 18938
$369,000C-
3 bd · 2.0 ba ·
1,880 sqft ·
Built 1994
· Manufactured
· Pending
· 6 DOM
Cashflow @ list (25.0% down · 7.5%)
Estimated rent
$3,525/mo
Mortgage (P&I)
−$1,935
Tax + insurance
−$413
HOA
−$0
Vac / Maint / Mgmt
−$740
Net cashflow
$437/mo
Annual
$5,242/yr
Cap rate
7.71%
Cash-on-cash
5.07%
DSCR
1.23
1% rule
0.96%
Cash to close
$103,320
Investor read
- This is a 3-bed/2.0-bath manufactured listed at $369k.
- At list price, monthly cash flow is $437 ($5k/yr) — positive.
- The deal already cash-flows at list — no discount required.
- To meet the 1% rule (rent ≥ 1% of price), the offer needs to be $353k (4.5% below list).
- Only 6 days on market — expect competitive offers; lowballing is unlikely to land.
- Recommended offer: $353k (4.5% below list) — sets the bar for 1% rule.
- Local home prices are declining (-3.0%/yr); year-one equity from $3k of loan paydown is wiped out by about $11k of value loss. Plan a longer hold.
- Location reads 75/100 on livability (#459 in PA, #4,183 nationally) — a middle-class / working-renter tenant base. Strengths: crime A+, employment A+, housing A+; Watch: amenities F, commute F, cost of living F.
- Central Bucks SD (suburban): math 55% / reading 71% proficiency, ranked #37 of 539 in PA (top 7%) — acceptable for families but not a draw, mixed tenant base, ~2y average lease; only 7% free/reduced lunch — higher-income household profile.
- Zoned schools: Central Bucks Hs-East (math 93%, 1,365 students, 7% FRL) — zoned schools at 7% FRL track the district average.
- Market conditions: 125 active listings in the ZIP; high-income renter base; 663 units permitted in Bucks County in 2024 (106 in 5+ unit buildings).
- Bucks County population projected to shrink 7% by 2050 — rents likely to lag national; underwrite the cash flow, not the appreciation.
- 6 sale attempts since 27y ago; this cycle's ask has dropped $26k (7%) from the opening price — seller is motivated, your offer sets the floor, not the list.
- Climate carrying-cost: major flood risk; major wind risk, 27% chance of damaging wind over 30y; extreme-heat days projected 7→15/yr by 2055 (HVAC capex compounding) — expect insurance premiums to compound above CPI over the hold.
- Cap rate 7.7% vs local median 2.7% in Richboro — top-decile yield for the area; either an underpriced asset or a hidden risk that comps aren't pricing in. Stress-test before assuming the spread holds.
Questions for listing agent
- Is there a deadline driving the sale (1031 exchange, divorce, estate, relocation)? That informs how much negotiation room exists.
- Schools are A-rated — typically a magnet for longer-tenancy family renters. What's the average tenant stay here, and is there a school-zone premium baked into asking?
- What's the average days-on-market for RENTAL listings here right now (not sales)? A rising rental-DOM trend means longer vacancies and softer asking-rent achievability than the comps imply.
- What's the recent tenant-quality profile in this submarket — average credit score on applications, eviction rate, late-payment / NSF rate, and stable-employment percentage? A property-management company in the area should have these aggregated.
- How much new for-sale + rental construction is in the pipeline within 1–3 miles? Heavy new supply typically softens prices + rents 12–24 months out; constrained supply supports both.
CashFlowRE · CFR-3MZYF66YRAM7H8
· Data 6 days ago
cashflowre.app · 2026-05-29