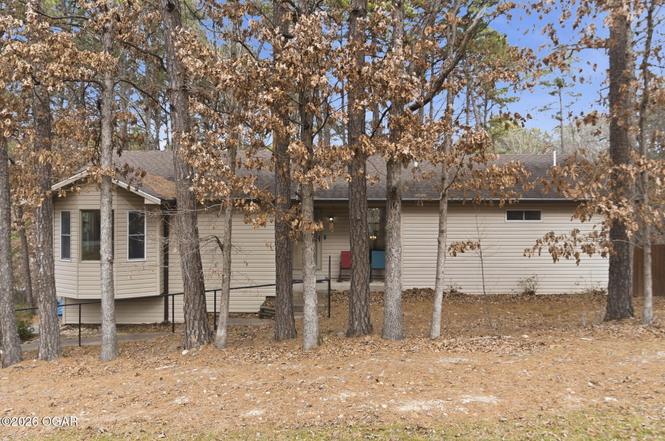
2 Ardley Ln
Bella Vista, AR 72714
$385,000B-
4 bd · 2.5 ba ·
2,142 sqft ·
Built 1992
· SingleFamily
· Pending
· 21 DOM
Cashflow @ list (25.0% down · 7.5%)
Estimated rent
$3,779/mo
Mortgage (P&I)
−$2,019
Tax + insurance
−$306
HOA
−$40
Vac / Maint / Mgmt
−$794
Net cashflow
$621/mo
Annual
$7,447/yr
Cap rate
8.23%
Cash-on-cash
6.91%
DSCR
1.31
1% rule
0.98%
Cash to close
$107,800
Investor read
- This is a 4-bed/2.5-bath single-family listed at $385k.
- At list price, monthly cash flow is $621 ($7k/yr) — positive.
- The deal already cash-flows at list — no discount required.
- To meet the 1% rule (rent ≥ 1% of price), the offer needs to be $378k (1.8% below list).
- It's been on market 21 days — a 2% lower offer ($379k) is reasonable based on typical stale-listing flexibility.
- Recommended offer: $378k (1.8% below list) — sets the bar for 1% rule.
- In year one you build about $8k of equity ($3k loan paydown + $5k appreciation (1.4% local appreciation)).
- Location reads 67/100 on livability (#111 in AR) — a middle-class / working-renter tenant base. Strengths: cost of living A+, housing A+, crime A; Watch: amenities F, commute F, health & safety F.
- Bentonville School District (urban): math 59% / reading 59% proficiency, ranked #3 of 238 in AR (top 1%) — acceptable for families but not a draw, mixed tenant base, ~2y average lease.
- Zoned schools: Cooper Elementary School (math 64% / reading 60%, grade B, #31 of 454 statewide, top 7%, 656 students, 29% FRL); Old High Middle School (math 51% / reading 60%, grade B-, #20 of 201 statewide, top 10%, 487 students, 22% FRL); Bentonville High School (math 52% / reading 61%, grade C, #8 of 292 statewide, top 2%, 3,322 students, 15% FRL) — zoned schools at 22% FRL track the district average.
- Market conditions: 475 active listings in the ZIP; 4 comparable units currently listed for rent nearby; rentals at typical pace (median 22d on market — plan ~3-4 weeks tenant-placement turnaround); solid renter incomes; 4,359 units permitted in Benton County in 2024 (402 in 5+ unit buildings).
- Benton County population projected at +56% by 2050 — long-run rental-demand tailwind backs the buy-and-hold thesis.
- 4 sale attempts since 6y ago with the ask held roughly flat each time — persistent listings suggest the price (not the market) is what's stuck; bring a comps-based counter.
- At projected returns (1.4% appreciation + 3.0% rent growth), your $108k cash investment doubles in ~6 years — after that, you're playing with house money.
- By year 5, paydown + projected appreciation supports a ~$36k cash-out refi (75% LTV) — recoverable capital for the next deal without selling this one.
- Cap rate 8.2% vs local median 3.6% in Bella Vista — top-decile yield for the area; either an underpriced asset or a hidden risk that comps aren't pricing in. Stress-test before assuming the spread holds.
- This rent runs 44% of the median local income ($103k/yr) — at the standard rent-burdened threshold; future hikes will face affordability resistance.
Questions for listing agent
- What does the HOA fee cover, when was the last increase, and are there any pending special assessments or reserve-fund shortfalls?
- Is there a deadline driving the sale (1031 exchange, divorce, estate, relocation)? That informs how much negotiation room exists.
- Schools are A-rated — typically a magnet for longer-tenancy family renters. What's the average tenant stay here, and is there a school-zone premium baked into asking?
- What's the average days-on-market for RENTAL listings here right now (not sales)? A rising rental-DOM trend means longer vacancies and softer asking-rent achievability than the comps imply.
- What's the recent tenant-quality profile in this submarket — average credit score on applications, eviction rate, late-payment / NSF rate, and stable-employment percentage? A property-management company in the area should have these aggregated.
- How much new for-sale + rental construction is in the pipeline within 1–3 miles? Heavy new supply typically softens prices + rents 12–24 months out; constrained supply supports both.
CashFlowRE · CFR-3P01S85RA0CZPY
· Data 3 weeks ago
cashflowre.app · 2026-05-29