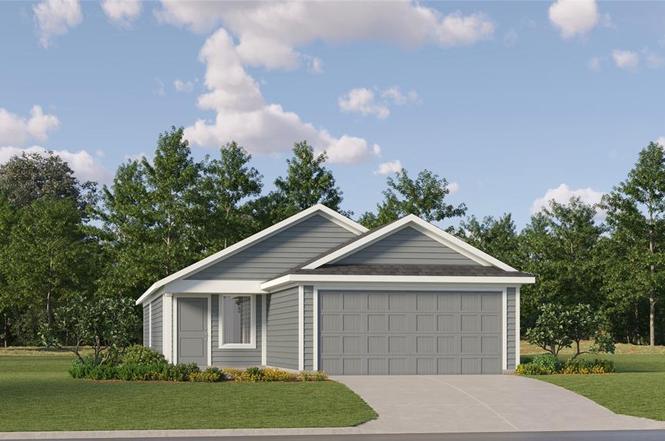
416 Sandhill Crane Ln
Wylie, TX 75407
$221,999D-
3 bd · 2.0 ba ·
1,402 sqft ·
Built 2025
· SingleFamily
· Pending
· 14 DOM
Cashflow @ list (25.0% down · 7.5%)
Estimated rent
$1,905/mo
Mortgage (P&I)
−$1,164
Tax + insurance
−$370
HOA
−$41
Vac / Maint / Mgmt
−$400
Net cashflow
$-71/mo
Annual
$-847/yr
Cap rate
5.91%
Cash-on-cash
-1.36%
DSCR
0.94
1% rule
0.86%
Cash to close
$62,160
Investor read
- This is a 3-bed/2.0-bath single-family listed at $222k. Condition is rated poor.
- At list price, monthly cash flow is $-71 ($-847/yr) — negative.
- To cash-flow at today's rent, offer at most $212k (4.6% below list).
- To meet the 1% rule (rent ≥ 1% of price), the offer needs to be $190k (14.2% below list).
- Only 14 days on market — expect competitive offers; lowballing is unlikely to land.
- Recommended offer: $190k (14.2% below list) — sets the bar for 1% rule.
- Local home prices are declining (-3.0%/yr); year-one equity from $2k of loan paydown is wiped out by about $7k of value loss. Plan a longer hold.
- Location reads 69/100 on livability (#419 in TX) — a middle-class / working-renter tenant base. Strengths: crime A+, employment A+, housing A+; Watch: amenities F, commute F, health & safety F.
- Princeton ISD (suburban): math 51% / reading 47% proficiency, ranked #188 of 826 in TX (top 23%) — families likely to look elsewhere, expect single-tenant / working-renter base with shorter leases.
- Zoned schools: Mayfield El (609 students, 73% FRL); Clark Middle (math 53% / reading 42%, grade C-, #408 of 1,662 statewide, top 25%, 707 students, 66% FRL); Princeton H S (math 52% / reading 54%, grade C-, #437 of 1,632 statewide, top 27%, 1,521 students, 57% FRL).
- Market conditions: Rents soft (-1.0%/yr); 1410 active listings in the ZIP; 40 comparable units currently listed for rent nearby; rentals at typical pace (median 19d on market — plan ~3-4 weeks tenant-placement turnaround); solid renter incomes; 19,194 units permitted in Collin County in 2024 (3,988 in 5+ unit buildings).
- Collin County population projected at +60% by 2050 — long-run rental-demand tailwind backs the buy-and-hold thesis.
- Cap rate 5.9% vs local median 4.0% in Wylie — top-decile yield for the area; either an underpriced asset or a hidden risk that comps aren't pricing in. Stress-test before assuming the spread holds.
Questions for listing agent
- What do current leases actually rent for vs. the listed asking? Can we see a recent rent roll and the last 12 months of T-12 income?
- Have any recent inspections been done? Can we get a copy of the seller's disclosures and any deferred-maintenance estimates?
- What does the HOA fee cover, when was the last increase, and are there any pending special assessments or reserve-fund shortfalls?
- Is there a deadline driving the sale (1031 exchange, divorce, estate, relocation)? That informs how much negotiation room exists.
- Schools are B-rated — typically a magnet for longer-tenancy family renters. What's the average tenant stay here, and is there a school-zone premium baked into asking?
- The area grade is low — what's the realistic commute time and amenity access for the typical tenant pool here? Any planned neighborhood developments (good or bad) we should know about?
- What's the average days-on-market for RENTAL listings here right now (not sales)? A rising rental-DOM trend means longer vacancies and softer asking-rent achievability than the comps imply.
- What's the recent tenant-quality profile in this submarket — average credit score on applications, eviction rate, late-payment / NSF rate, and stable-employment percentage? A property-management company in the area should have these aggregated.
Repairs flagged (vision-AI assessment)
- Major: roof — Significant wear and tear visible.
- Major: exterior siding — Severe damage and discoloration present.
- Major: landscaping — No visible landscaping or curb appeal.
- Major: interior walls/paint — No visible interior walls or paint condition.
- Major: bathrooms — No visible bathroom condition.
- Major: kitchen — No visible kitchen condition.
CashFlowRE · CFR-3PNVKME1JBB60Z
· Data 4 weeks ago
cashflowre.app · 2026-05-29