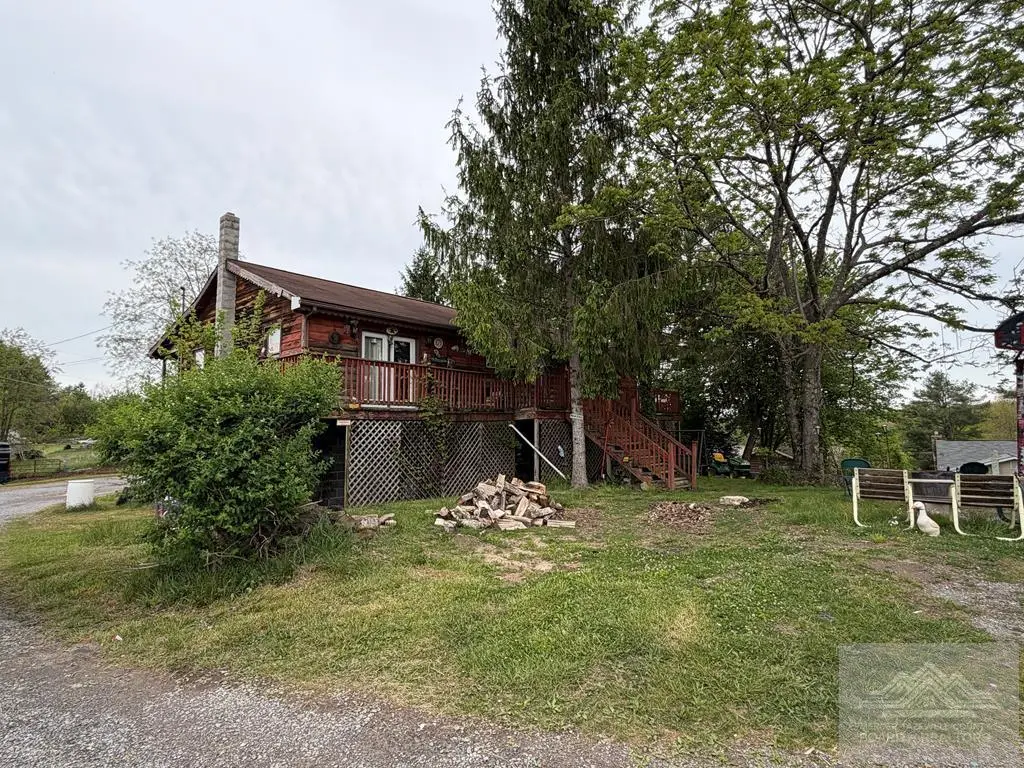
161 Modern Ln
Princeton, WV 24740
$124,900D+
2 bd · 1.0 ba ·
1,200 sqft ·
Built 1989
· SingleFamily
· Active
· 49 DOM
Cashflow @ list (25.0% down · 7.5%)
Estimated rent
$907/mo
Mortgage (P&I)
−$655
Tax + insurance
−$208
HOA
−$0
Vac / Maint / Mgmt
−$191
Net cashflow
$-146/mo
Annual
$-1,758/yr
Cap rate
4.89%
Cash-on-cash
-5.03%
DSCR
0.78
1% rule
0.73%
Cash to close
$34,972
Investor read
- This is a 2-bed/1.0-bath single-family listed at $125k.
- At list price, monthly cash flow is $-146 ($-2k/yr) — negative.
- To cash-flow at today's rent, offer at most $104k (17.0% below list).
- To meet the 1% rule (rent ≥ 1% of price), the offer needs to be $91k (27.4% below list).
- It's been on market 49 days — a 3% lower offer ($121k) is reasonable based on typical stale-listing flexibility.
- Recommended offer: $91k (27.4% below list) — sets the bar for 1% rule.
- In year one you build about $13k of equity ($864 loan paydown + $12k appreciation (10.0% local appreciation)).
- Location reads 72/100 on livability (#53 in WV) — a middle-class / working-renter tenant base. Strengths: cost of living A+, housing A+, crime B+; Watch: amenities D, commute F, employment F.
- Mercer County Schools (town): math 26% / reading 37% proficiency, ranked #28 of 55 in WV (top 51%) — families likely to look elsewhere, expect single-tenant / working-renter base with shorter leases.
- Zoned schools: Princeton Primary School (499 students, 0% FRL) — zoned schools average 0% FRL vs 54% district-wide (54 pts lower); this property's tenant base skews higher-income than the district average.
- Market conditions: 48 active listings in the ZIP; lower-income renter base — watch delinquency; 4 units permitted in Mercer County in 2024 (0 in 5+ unit buildings).
- Mercer County population projected at -18% by 2050 — secular population decline; favor cash flow + early exit over multi-decade hold.
- By year 3, paydown + projected appreciation supports a ~$34k cash-out refi (75% LTV) — recoverable capital for the next deal without selling this one.
- Cap rate 4.9% vs local median 3.7% in Princeton — top-decile yield for the area; either an underpriced asset or a hidden risk that comps aren't pricing in. Stress-test before assuming the spread holds.
Questions for listing agent
- What do current leases actually rent for vs. the listed asking? Can we see a recent rent roll and the last 12 months of T-12 income?
- It's been on market 49 days. Have you received any prior offers? Is the seller open to a 27% concession, seller financing, or rate buy-down credit?
- Is there a deadline driving the sale (1031 exchange, divorce, estate, relocation)? That informs how much negotiation room exists.
- Schools are B-rated — typically a magnet for longer-tenancy family renters. What's the average tenant stay here, and is there a school-zone premium baked into asking?
- The area grade is low — what's the realistic commute time and amenity access for the typical tenant pool here? Any planned neighborhood developments (good or bad) we should know about?
- What's the average days-on-market for RENTAL listings here right now (not sales)? A rising rental-DOM trend means longer vacancies and softer asking-rent achievability than the comps imply.
- What's the recent tenant-quality profile in this submarket — average credit score on applications, eviction rate, late-payment / NSF rate, and stable-employment percentage? A property-management company in the area should have these aggregated.
- How much new for-sale + rental construction is in the pipeline within 1–3 miles? Heavy new supply typically softens prices + rents 12–24 months out; constrained supply supports both.
CashFlowRE · CFR-3RMVRCF6AMMGEQ
· Data 23 h ago
cashflowre.app · 2026-05-29