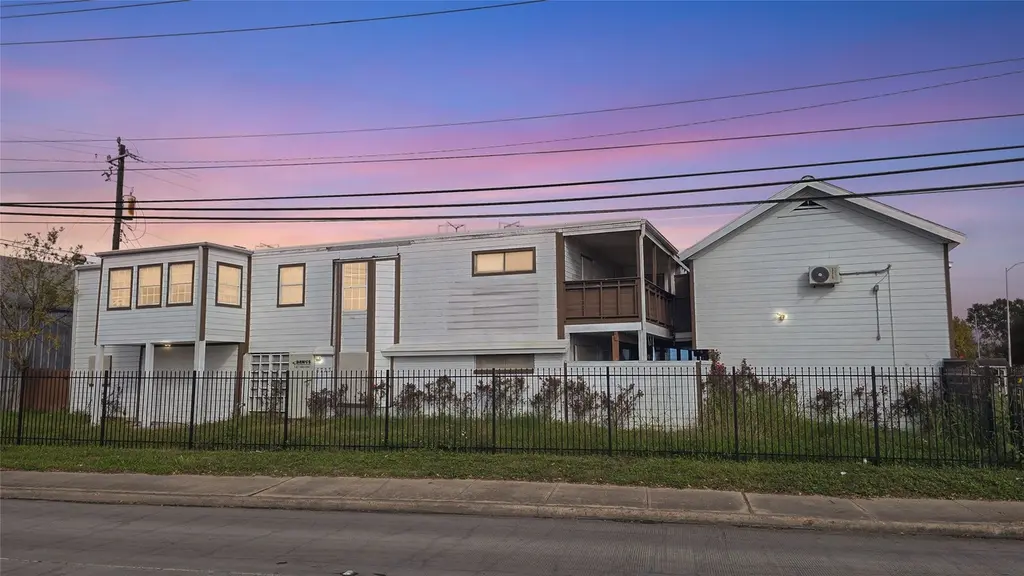
6723 South Loop E #9
Houston, TX 77087
$649,900B-
None bd · None ba ·
6,234 sqft ·
Built 1954
· MultiFamily
· Active
· 184 DOM
Cashflow @ list (25.0% down · 7.5%)
Estimated rent
$8,947/mo
Mortgage (P&I)
−$3,408
Tax + insurance
−$1,209
HOA
−$0
Vac / Maint / Mgmt
−$1,879
Net cashflow
$2,450/mo
Annual
$29,406/yr
Cap rate
10.94%
Cash-on-cash
16.60%
DSCR
1.74
1% rule
1.38%
Cash to close
$181,972
Investor read
- This is a multifamily listed at $650k.
- At list price, monthly cash flow is $2k ($29k/yr) — positive.
- The deal already cash-flows at list — no discount required.
- Meets the 1% rule at list price ($9k rent vs $650k).
- It's been on market 184 days — a 12% lower offer ($572k) is reasonable based on typical stale-listing flexibility.
- Recommended offer: $572k (12.0% below list) — sets the bar for market timing.
- Local home prices are declining (-3.0%/yr); year-one equity from $4k of loan paydown is wiped out by about $19k of value loss. Plan a longer hold.
- Location reads 74/100 on livability (#184 in TX, #4,771 nationally) — a middle-class / working-renter tenant base. Strengths: amenities A+, cost of living A+, housing A+; Watch: schools D, crime F.
- Houston ISD (urban): math 27% / reading 35% proficiency, ranked #593 of 826 in TX (top 72%) — families likely to look elsewhere, expect single-tenant / working-renter base with shorter leases; 71% free/reduced lunch — lower-income household profile, screen leases tightly.
- Watch-outs: flood insurance adds $66/mo; built in 1954 — expect roof / HVAC / electrical / plumbing capex.
- Market conditions: Rents flat; 84 active listings in the ZIP; 29,883 units permitted in Harris County in 2024 (8,621 in 5+ unit buildings).
- Harris County population projected at +47% by 2050 — long-run rental-demand tailwind backs the buy-and-hold thesis.
- At projected returns (-3.0% appreciation + 0.6% rent growth), your $182k cash investment doubles in ~10 years — after that, you're playing with house money.
- Climate carrying-cost: major flood risk; severe wind risk, 99% chance of damaging wind over 30y; extreme-heat days projected 7→25/yr by 2055 (HVAC capex compounding) — expect insurance premiums to compound above CPI over the hold.
- Cap rate 10.9% vs local median 3.2% in Houston — top-decile yield for the area; either an underpriced asset or a hidden risk that comps aren't pricing in. Stress-test before assuming the spread holds.
- At $8,947/mo this rent would consume 203% of the median local household income ($53k/yr) (locally 1219% of renters already pay >50% of income on rent) — very limited rent-growth headroom before tenants either downsize or default.
Questions for listing agent
- It's been on market 184 days. Have you received any prior offers? Is the seller open to a 12% concession, seller financing, or rate buy-down credit?
- Built in 1954 — when were the roof, HVAC, electrical panel, plumbing, and water heater last replaced?
- What's the actual annual flood-insurance premium (NFIP or private), and is the property in a SFHA with mandatory coverage?
- Why hasn't it sold? Are there any deal-killer items the seller is aware of (foundation, flood, title, zoning, code violations)?
- Is there a deadline driving the sale (1031 exchange, divorce, estate, relocation)? That informs how much negotiation room exists.
- Schools are D-rated, which usually means shorter tenancies and higher turnover. Who's the typical renter profile here, and what's been the actual vacancy rate?
- Crime grade is F in this area — have there been break-ins, vandalism, or insurance claims at this property in the last 3 years? What carrier currently insures it and at what premium?
- What's the average days-on-market for RENTAL listings here right now (not sales)? A rising rental-DOM trend means longer vacancies and softer asking-rent achievability than the comps imply.
CashFlowRE · CFR-3RQ9VH425241C5
· Data 4 h ago
cashflowre.app · 2026-05-29