310 Dogwood Rd
Pikeville, TN 37367
$129,900B-
1 bd · 1.0 ba ·
540 sqft ·
Built 1997
· SingleFamily
· Active
· 57 DOM
Cashflow @ list (25.0% down · 7.5%)
Estimated rent
$1,951/mo
Mortgage (P&I)
−$681
Tax + insurance
−$216
HOA
−$0
Vac / Maint / Mgmt
−$410
Net cashflow
$644/mo
Annual
$7,725/yr
Cap rate
12.24%
Cash-on-cash
21.24%
DSCR
1.95
1% rule
1.50%
Cash to close
$36,372
Investor read
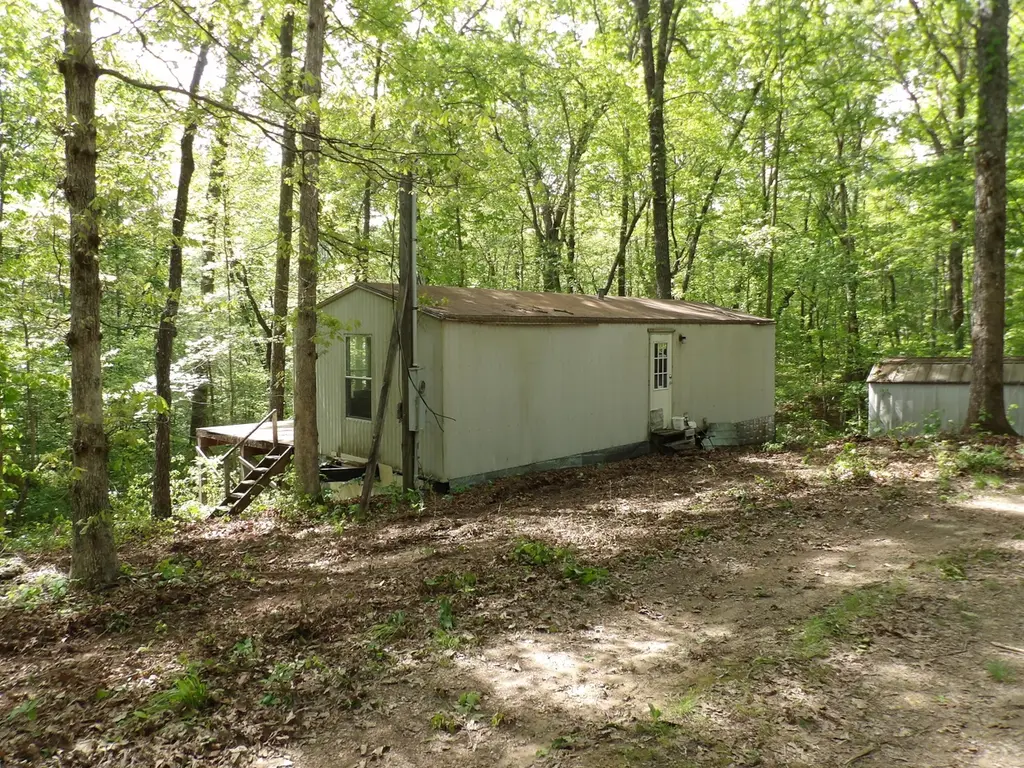
- This is a 1-bed/1.0-bath single-family listed at $130k. Condition is rated fair.
- At list price, monthly cash flow is $644 ($8k/yr) — positive.
- The deal already cash-flows at list — no discount required.
- Meets the 1% rule at list price ($2k rent vs $130k).
- It's been on market 57 days — a 3% lower offer ($126k) is reasonable based on typical stale-listing flexibility.
- Recommended offer: $126k (3.0% below list) — sets the bar for market timing.
- In year one you build about $14k of equity ($898 loan paydown + $13k appreciation (10.0% local appreciation)).
- Location reads 59/100 on livability (#296 in TN) — a working-class tenant base; expect higher turnover. Strengths: cost of living A+, crime A, housing B+; Watch: health & safety C-, schools F, amenities F.
- Bledsoe County (rural): math 19% / reading 27% proficiency, ranked #104 of 139 in TN (top 75%) — low school quality limits family demand, transient renter base, plan for 1-2y turnover; 69% free/reduced lunch — lower-income household profile, screen leases tightly.
- Market conditions: 155 active listings in the ZIP.
- Bledsoe County population projected at +36% by 2050 — long-run rental-demand tailwind backs the buy-and-hold thesis.
- 2 sale attempts since 13y ago with the ask held roughly flat each time — persistent listings suggest the price (not the market) is what's stuck; bring a comps-based counter.
- At projected returns (10.0% appreciation + 3.0% rent growth), your $36k cash investment doubles in ~2 years — after that, you're playing with house money.
- By year 3, paydown + projected appreciation supports a ~$35k cash-out refi (75% LTV) — recoverable capital for the next deal without selling this one.
- Climate carrying-cost: major wildfire risk — expect insurance premiums to compound above CPI over the hold.
- Cap rate 12.2% vs local median 4.8% in Pikeville — top-decile yield for the area; either an underpriced asset or a hidden risk that comps aren't pricing in. Stress-test before assuming the spread holds.
- This rent runs 43% of the median local income ($55k/yr) — at the standard rent-burdened threshold; future hikes will face affordability resistance.
Questions for listing agent
- It's been on market 57 days. Have you received any prior offers? Is the seller open to a 3% concession, seller financing, or rate buy-down credit?
- Have any recent inspections been done? Can we get a copy of the seller's disclosures and any deferred-maintenance estimates?
- Is there a deadline driving the sale (1031 exchange, divorce, estate, relocation)? That informs how much negotiation room exists.
- Schools are F-rated, which usually means shorter tenancies and higher turnover. Who's the typical renter profile here, and what's been the actual vacancy rate?
- What's the average days-on-market for RENTAL listings here right now (not sales)? A rising rental-DOM trend means longer vacancies and softer asking-rent achievability than the comps imply.
- What's the recent tenant-quality profile in this submarket — average credit score on applications, eviction rate, late-payment / NSF rate, and stable-employment percentage? A property-management company in the area should have these aggregated.
- How much new for-sale + rental construction is in the pipeline within 1–3 miles? Heavy new supply typically softens prices + rents 12–24 months out; constrained supply supports both.
Repairs flagged (vision-AI assessment)
- Major: Siding — Severe weathering and rust
- Major: Shed — Significant rust
- Major: Carpet — Worn and outdated
- Major: Appliances — Old and outdated
- Major: Fixtures — Worn and outdated
- Major: Wallpaper — Worn and outdated
CashFlowRE · CFR-3RSW3Z9AWENDF2
· Data 2 days ago
cashflowre.app · 2026-05-29