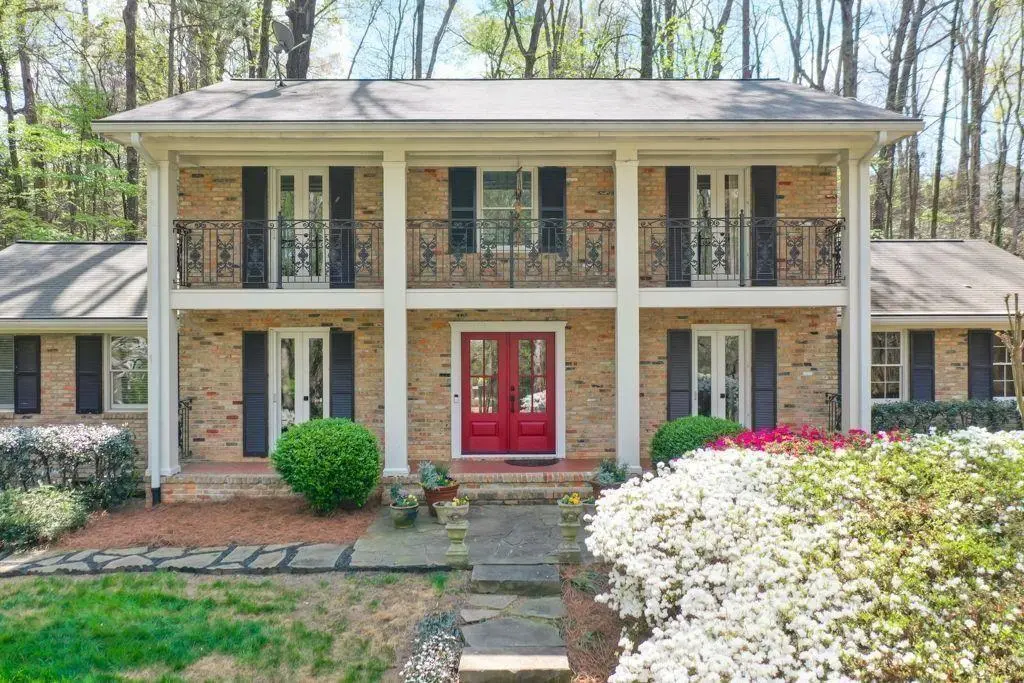
430 River Valley Rd NW
Sandy Springs, GA 30328
$750,000C-
4 bd · 3.0 ba ·
2,713 sqft ·
Built 1963
· SingleFamily
· Pending
· 50 DOM
Cashflow @ list (25.0% down · 7.5%)
Estimated rent
$6,948/mo
Mortgage (P&I)
−$3,933
Tax + insurance
−$603
HOA
−$0
Vac / Maint / Mgmt
−$1,459
Net cashflow
$953/mo
Annual
$11,434/yr
Cap rate
7.82%
Cash-on-cash
5.44%
DSCR
1.24
1% rule
0.93%
Cash to close
$210,000
Investor read
- This is a 4-bed/3.0-bath single-family listed at $750k.
- At list price, monthly cash flow is $953 ($11k/yr) — positive.
- The deal already cash-flows at list — no discount required.
- To meet the 1% rule (rent ≥ 1% of price), the offer needs to be $695k (7.4% below list).
- It's been on market 50 days — a 3% lower offer ($728k) is reasonable based on typical stale-listing flexibility.
- Recommended offer: $695k (7.4% below list) — sets the bar for 1% rule.
- Local home prices are declining (-3.0%/yr); year-one equity from $5k of loan paydown is wiped out by about $22k of value loss. Plan a longer hold.
- Location reads 73/100 on livability (#45 in GA) — a middle-class / working-renter tenant base. Strengths: employment A+, crime A-, commute A-; Watch: amenities F, cost of living F.
- Fulton County (suburban): math 49% / reading 53% proficiency, ranked #12 of 174 in GA (top 7%) — acceptable for families but not a draw, mixed tenant base, ~2y average lease.
- Market conditions: Rents soft (-0.2%/yr); 369 active listings in the ZIP; 6 comparable units currently listed for rent nearby; rentals at typical pace (median 24d on market — plan ~3-4 weeks tenant-placement turnaround); high-income renter base; 11,565 units permitted in Fulton County in 2024 (8,159 in 5+ unit buildings).
- Fulton County population projected at +38% by 2050 — long-run rental-demand tailwind backs the buy-and-hold thesis.
- 2 sale attempts; this cycle's ask has dropped $125k (14%) from the opening price — seller is motivated, your offer sets the floor, not the list.
- Current owner paid $445k; list at $750k implies a 69% gain — meaningful room to come down on a strong offer.
- Climate carrying-cost: extreme-heat days projected 6→16/yr by 2055 (HVAC capex compounding) — expect insurance premiums to compound above CPI over the hold.
- Cap rate 7.8% vs local median 2.7% in Sandy Springs — top-decile yield for the area; either an underpriced asset or a hidden risk that comps aren't pricing in. Stress-test before assuming the spread holds.
- At $6,948/mo this rent would consume 74% of the median local household income ($112k/yr) (locally 1884% of renters already pay >50% of income on rent) — very limited rent-growth headroom before tenants either downsize or default.
Questions for listing agent
- It's been on market 50 days. Have you received any prior offers? Is the seller open to a 7% concession, seller financing, or rate buy-down credit?
- Built in 1963 — when were the roof, HVAC, electrical panel, plumbing, and water heater last replaced?
- Is there a deadline driving the sale (1031 exchange, divorce, estate, relocation)? That informs how much negotiation room exists.
- What's the average days-on-market for RENTAL listings here right now (not sales)? A rising rental-DOM trend means longer vacancies and softer asking-rent achievability than the comps imply.
- What's the recent tenant-quality profile in this submarket — average credit score on applications, eviction rate, late-payment / NSF rate, and stable-employment percentage? A property-management company in the area should have these aggregated.
- How much new for-sale + rental construction is in the pipeline within 1–3 miles? Heavy new supply typically softens prices + rents 12–24 months out; constrained supply supports both.
CashFlowRE · CFR-3ZT63TCW8F233Z
· Data 3 weeks ago
cashflowre.app · 2026-05-29