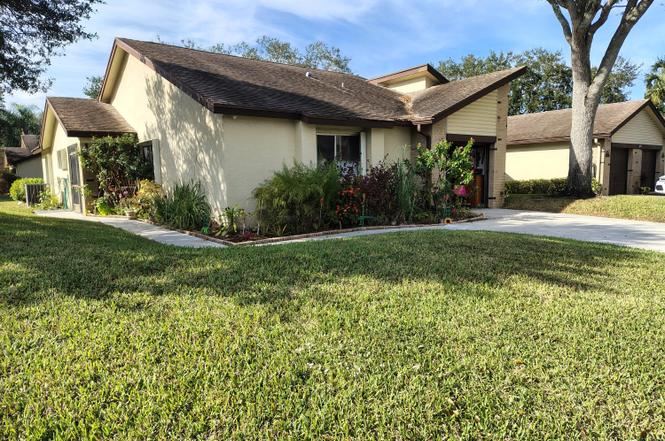
125 Ramblewood Cir
Royal Palm Beach, FL 33411
$304,000D
3 bd · 2.0 ba ·
1,676 sqft ·
Built 1982
· Townhouse
· Active
· 189 DOM
Cashflow @ list (25.0% down · 7.5%)
Estimated rent
$2,772/mo
Mortgage (P&I)
−$1,594
Tax + insurance
−$392
HOA
−$680
Vac / Maint / Mgmt
−$582
Net cashflow
$-476/mo
Annual
$-5,716/yr
Cap rate
4.41%
Cash-on-cash
-6.72%
DSCR
0.70
1% rule
0.91%
Cash to close
$85,120
Investor read
- This is a 3-bed/2.0-bath townhouse listed at $304k.
- At list price, monthly cash flow is $-476 ($-6k/yr) — negative.
- To cash-flow at today's rent, offer at most $220k (27.7% below list).
- To meet the 1% rule (rent ≥ 1% of price), the offer needs to be $277k (8.8% below list).
- It's been on market 189 days — a 12% lower offer ($268k) is reasonable based on typical stale-listing flexibility.
- Recommended offer: $220k (27.7% below list) — sets the bar for cash-flow.
- In year one you build about $33k of equity ($2k loan paydown + $30k appreciation (10.0% local appreciation)).
- Location reads 79/100 on livability (#135 in FL, #2,039 nationally) — a middle-class / working-renter tenant base. Strengths: employment A+, housing A+, health & safety A+; Watch: cost of living C-, amenities F, commute F.
- Palm Beach (suburban): math 46% / reading 53% proficiency, ranked #34 of 73 in FL (top 47%) — families likely to look elsewhere, expect single-tenant / working-renter base with shorter leases.
- Watch-outs: HOA is 25% of rent.
- Market conditions: Rents flat; 574 active listings in the ZIP; 40 comparable units currently listed for rent nearby; rentals at typical pace (median 25d on market — plan ~3-4 weeks tenant-placement turnaround); solid renter incomes; 3,974 units permitted in Palm Beach County in 2024 (1,012 in 5+ unit buildings).
- Palm Beach County population projected at +30% by 2050 — long-run rental-demand tailwind backs the buy-and-hold thesis.
- 4 sale attempts since 3y ago with the ask held roughly flat each time — persistent listings suggest the price (not the market) is what's stuck; bring a comps-based counter.
- By year 2, paydown + projected appreciation supports a ~$52k cash-out refi (75% LTV) — recoverable capital for the next deal without selling this one.
- Climate carrying-cost: severe wind risk, 99% chance of damaging wind over 30y; extreme-heat days projected 7→27/yr by 2055 (HVAC capex compounding) — expect insurance premiums to compound above CPI over the hold.
- This rent runs 36% of the median local income ($93k/yr) — at the standard rent-burdened threshold; future hikes will face affordability resistance.
Questions for listing agent
- What do current leases actually rent for vs. the listed asking? Can we see a recent rent roll and the last 12 months of T-12 income?
- It's been on market 189 days. Have you received any prior offers? Is the seller open to a 28% concession, seller financing, or rate buy-down credit?
- What does the HOA fee cover, when was the last increase, and are there any pending special assessments or reserve-fund shortfalls?
- Why hasn't it sold? Are there any deal-killer items the seller is aware of (foundation, flood, title, zoning, code violations)?
- Is there a deadline driving the sale (1031 exchange, divorce, estate, relocation)? That informs how much negotiation room exists.
- Schools are B-rated — typically a magnet for longer-tenancy family renters. What's the average tenant stay here, and is there a school-zone premium baked into asking?
- The area grade is low — what's the realistic commute time and amenity access for the typical tenant pool here? Any planned neighborhood developments (good or bad) we should know about?
- What's the average days-on-market for RENTAL listings here right now (not sales)? A rising rental-DOM trend means longer vacancies and softer asking-rent achievability than the comps imply.
CashFlowRE · CFR-42NQF95DF947KS
· Data 2 days ago
cashflowre.app · 2026-05-29