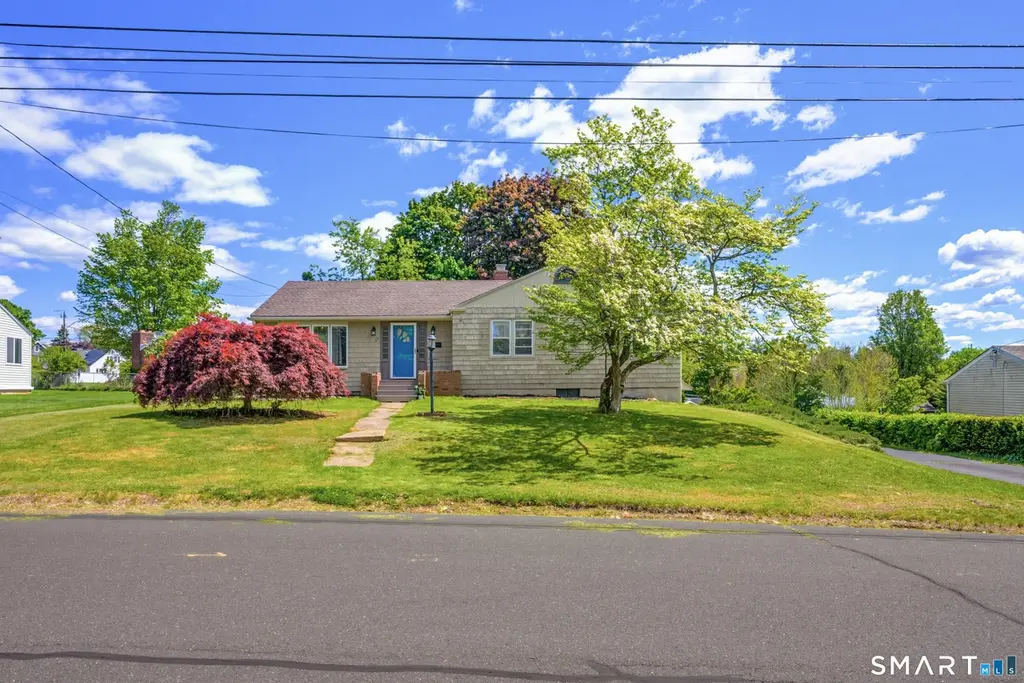
55 Blodgett Roy Dr
New Britain, CT 06053
$299,900C-
3 bd · 2.0 ba ·
1,686 sqft ·
Built 1954
· SingleFamily
· Under Contract
· 3 DOM
Cashflow @ list (25.0% down · 7.5%)
Estimated rent
$2,737/mo
Mortgage (P&I)
−$1,573
Tax + insurance
−$723
HOA
−$0
Vac / Maint / Mgmt
−$575
Net cashflow
$-133/mo
Annual
$-1,595/yr
Cap rate
5.76%
Cash-on-cash
-1.90%
DSCR
0.92
1% rule
0.91%
Cash to close
$83,972
Investor read
- This is a 3-bed/2.0-bath single-family listed at $300k.
- At list price, monthly cash flow is $-133 ($-2k/yr) — negative.
- To cash-flow at today's rent, offer at most $276k (7.8% below list).
- To meet the 1% rule (rent ≥ 1% of price), the offer needs to be $274k (8.7% below list).
- Only 3 days on market — expect competitive offers; lowballing is unlikely to land.
- Recommended offer: $274k (8.7% below list) — sets the bar for 1% rule.
- In year one you build about $32k of equity ($2k loan paydown + $30k appreciation (10.0% local appreciation)).
- Location reads 74/100 on livability (#67 in CT, #4,936 nationally) — a middle-class / working-renter tenant base. Strengths: health & safety A+, cost of living A, housing A; Watch: crime D, employment D.
- New Britain School District (suburban): math 6% / reading 17% proficiency, ranked #153 of 153 in CT (top 100%) — low school quality limits family demand, transient renter base, plan for 1-2y turnover; 71% free/reduced lunch — lower-income household profile, screen leases tightly.
- Zoned schools: Holmes Elementary School (math 11% / reading 23%, grade F, #459 of 553 statewide, top 84%, 460 students, 65% FRL); New Britain High School (math 10% / reading 31%, grade F, #162 of 194 statewide, top 83%, 2,331 students, 71% FRL) — zoned schools at 68% FRL track the district average.
- Watch-outs: built in 1954 — expect roof / HVAC / electrical / plumbing capex.
- Market conditions: Rents rising fast (+4.9%/yr); 69 active listings in the ZIP; 7 comparable units currently listed for rent nearby; rentals leasing fast (median 12d on market — plan ~1-2 weeks tenant-placement turnaround); 1,867 units permitted in Capitol Planning Region in 2024 (1,399 in 5+ unit buildings).
- 3 sale attempts since 11y ago with the ask held roughly flat each time — persistent listings suggest the price (not the market) is what's stuck; bring a comps-based counter.
- Current owner paid $187k; list at $300k implies a 60% gain — meaningful room to come down on a strong offer.
- By year 2, paydown + projected appreciation supports a ~$52k cash-out refi (75% LTV) — recoverable capital for the next deal without selling this one.
- Cap rate 5.8% vs local median 4.2% in New Britain — top-decile yield for the area; either an underpriced asset or a hidden risk that comps aren't pricing in. Stress-test before assuming the spread holds.
- At $2,737/mo this rent would consume 52% of the median local household income ($63k/yr) (locally 1835% of renters already pay >50% of income on rent) — very limited rent-growth headroom before tenants either downsize or default.
Questions for listing agent
- What do current leases actually rent for vs. the listed asking? Can we see a recent rent roll and the last 12 months of T-12 income?
- Built in 1954 — when were the roof, HVAC, electrical panel, plumbing, and water heater last replaced?
- Is there a deadline driving the sale (1031 exchange, divorce, estate, relocation)? That informs how much negotiation room exists.
- Schools are F-rated, which usually means shorter tenancies and higher turnover. Who's the typical renter profile here, and what's been the actual vacancy rate?
- Crime grade is D in this area — have there been break-ins, vandalism, or insurance claims at this property in the last 3 years? What carrier currently insures it and at what premium?
- What's the average days-on-market for RENTAL listings here right now (not sales)? A rising rental-DOM trend means longer vacancies and softer asking-rent achievability than the comps imply.
- What's the recent tenant-quality profile in this submarket — average credit score on applications, eviction rate, late-payment / NSF rate, and stable-employment percentage? A property-management company in the area should have these aggregated.
- How much new for-sale + rental construction is in the pipeline within 1–3 miles? Heavy new supply typically softens prices + rents 12–24 months out; constrained supply supports both.
CashFlowRE · CFR-44VV8B9J86RB3E
· Data 3 weeks ago
cashflowre.app · 2026-05-29