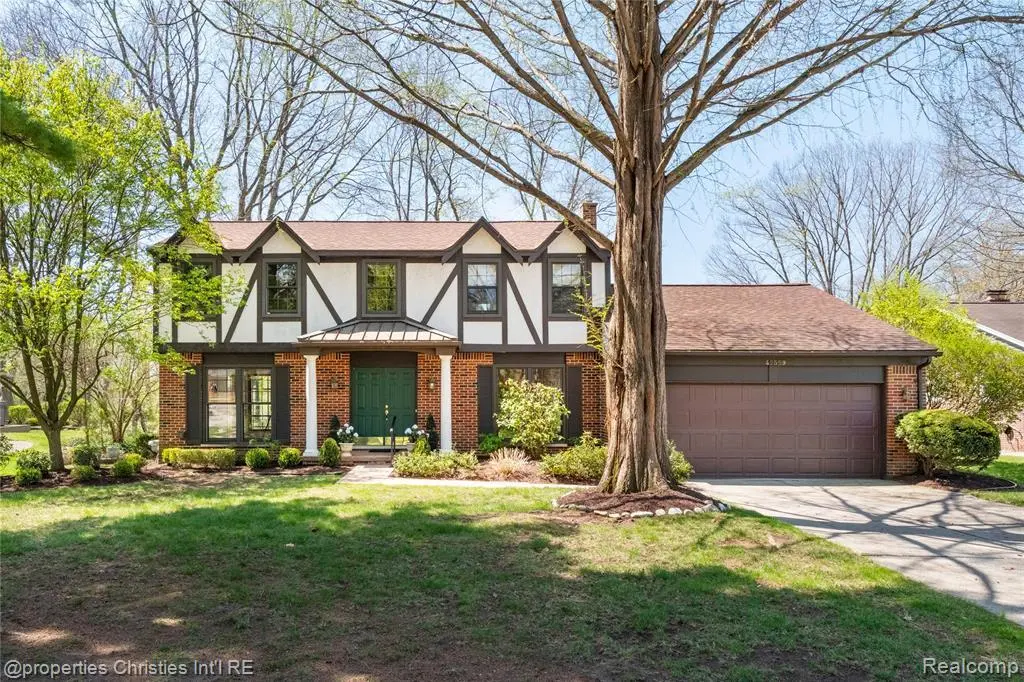
42559 Steepleview St
Plymouth, MI 48168
$600,000B
4 bd · 2.5 ba ·
2,369 sqft ·
Built 1980
· SingleFamily
· Pending
· 4 DOM
Cashflow @ list (25.0% down · 7.5%)
Estimated rent
$6,580/mo
Mortgage (P&I)
−$3,146
Tax + insurance
−$558
HOA
−$16
Vac / Maint / Mgmt
−$1,382
Net cashflow
$1,478/mo
Annual
$17,732/yr
Cap rate
9.25%
Cash-on-cash
10.55%
DSCR
1.47
1% rule
1.10%
Cash to close
$168,000
Investor read
- This is a 4-bed/2.5-bath single-family listed at $600k.
- At list price, monthly cash flow is $1k ($18k/yr) — positive.
- The deal already cash-flows at list — no discount required.
- Meets the 1% rule at list price ($7k rent vs $600k).
- Only 4 days on market — expect competitive offers; lowballing is unlikely to land.
- Local home prices are declining (-3.0%/yr); year-one equity from $4k of loan paydown is wiped out by about $18k of value loss. Plan a longer hold.
- Location reads 85/100 on livability (#25 in MI, #516 nationally) — a professional / high-income tenant draw. Strengths: crime A+, amenities A+, employment A+; Watch: commute F.
- Northville Public Schools (suburban): math 68% / reading 75% proficiency, ranked #4 of 540 in MI (top 1%) — strong family-tenant draw, lease renewals of 3-5y typical; only 4% free/reduced lunch — higher-income household profile.
- Zoned schools: Winchester Elementary School (math 67% / reading 72%, grade A-, #74 of 1,397 statewide, top 7%, 476 students, 6% FRL); Meads Mill Middle School (math 65% / reading 74%, grade A, #28 of 493 statewide, top 6%, 671 students, 9% FRL); Northville High School (math 68% / reading 86%, grade A-, #11 of 713 statewide, top 2%, 2,499 students, 7% FRL) — zoned schools at 7% FRL track the district average.
- Market conditions: 146 active listings in the ZIP; 3 comparable units currently listed for rent nearby; rentals leasing fast (median 5d on market — plan ~1-2 weeks tenant-placement turnaround); 2,639 units permitted in Wayne County in 2024 (1,216 in 5+ unit buildings).
- Wayne County population projected at -17% by 2050 — secular population decline; favor cash flow + early exit over multi-decade hold.
- 2 sale attempts with the ask held roughly flat each time — persistent listings suggest the price (not the market) is what's stuck; bring a comps-based counter.
- Cap rate 9.2% vs local median 3.2% in Plymouth — top-decile yield for the area; either an underpriced asset or a hidden risk that comps aren't pricing in. Stress-test before assuming the spread holds.
Questions for listing agent
- What does the HOA fee cover, when was the last increase, and are there any pending special assessments or reserve-fund shortfalls?
- Is there a deadline driving the sale (1031 exchange, divorce, estate, relocation)? That informs how much negotiation room exists.
- Schools are A-rated — typically a magnet for longer-tenancy family renters. What's the average tenant stay here, and is there a school-zone premium baked into asking?
- This sits on a lake — are riparian / water-frontage rights deeded with the parcel? Any dock permits, shoreline easements, or HOA water-use restrictions?
- What's the documented flood / surge / shoreline-erosion history here (FEMA AND non-FEMA — e.g., storm surge, creek backup, septic-field saturation)?
- Any water-quality or seasonal algae-bloom issues that affect tenant satisfaction or short-term-rental demand?
- What's the average days-on-market for RENTAL listings here right now (not sales)? A rising rental-DOM trend means longer vacancies and softer asking-rent achievability than the comps imply.
- What's the recent tenant-quality profile in this submarket — average credit score on applications, eviction rate, late-payment / NSF rate, and stable-employment percentage? A property-management company in the area should have these aggregated.
CashFlowRE · CFR-453HQJ127RKMV1
· Data 3 weeks ago
cashflowre.app · 2026-05-29