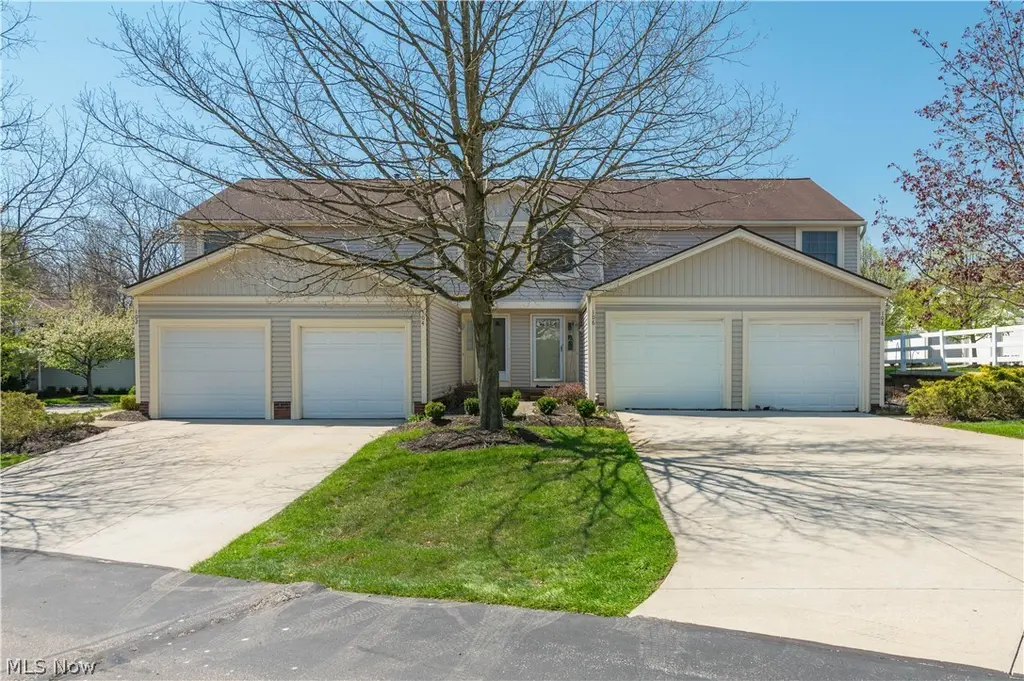
106 Maria Dr
Bedford, OH 44146
$115,000C-
2 bd · 2.0 ba ·
1,032 sqft ·
Built 1986
· Condo
· Pending
· 41 DOM
Cashflow @ list (25.0% down · 7.5%)
Estimated rent
$1,398/mo
Mortgage (P&I)
−$603
Tax + insurance
−$192
HOA
−$203
Vac / Maint / Mgmt
−$294
Net cashflow
$107/mo
Annual
$1,280/yr
Cap rate
7.41%
Cash-on-cash
3.97%
DSCR
1.18
1% rule
1.22%
Cash to close
$32,200
Investor read
- This is a 2-bed/2.0-bath condo listed at $115k. Condition is rated fair.
- At list price, monthly cash flow is $107 ($1k/yr) — positive.
- The deal already cash-flows at list — no discount required.
- Meets the 1% rule at list price ($1k rent vs $115k).
- It's been on market 41 days — a 3% lower offer ($112k) is reasonable based on typical stale-listing flexibility.
- Recommended offer: $112k (3.0% below list) — sets the bar for market timing.
- Local home prices are declining (-3.0%/yr); year-one equity from $795 of loan paydown is wiped out by about $3k of value loss. Plan a longer hold.
- Location reads 73/100 on livability (#324 in OH) — a middle-class / working-renter tenant base. Strengths: crime A+, cost of living A+, housing A+; Watch: amenities F, commute F, employment D-.
- Bedford City (suburban): math 19% / reading 32% proficiency, ranked #597 of 656 in OH (top 91%) — low school quality limits family demand, transient renter base, plan for 1-2y turnover.
- Market conditions: Rents rising fast (+5.8%/yr); 105 active listings in the ZIP; 35 comparable units currently listed for rent nearby; rentals at typical pace (median 17d on market — plan ~3-4 weeks tenant-placement turnaround); 1,441 units permitted in Cuyahoga County in 2024 (700 in 5+ unit buildings).
- Cuyahoga County population projected to shrink 8% by 2050 — rents likely to lag national; underwrite the cash flow, not the appreciation.
- Cap rate 7.4% vs local median 5.4% in Bedford — top-decile yield for the area; either an underpriced asset or a hidden risk that comps aren't pricing in. Stress-test before assuming the spread holds.
- This rent runs 31% of the median local income ($55k/yr) — at the standard rent-burdened threshold; future hikes will face affordability resistance.
Questions for listing agent
- It's been on market 41 days. Have you received any prior offers? Is the seller open to a 3% concession, seller financing, or rate buy-down credit?
- Have any recent inspections been done? Can we get a copy of the seller's disclosures and any deferred-maintenance estimates?
- What does the HOA fee cover, when was the last increase, and are there any pending special assessments or reserve-fund shortfalls?
- Any open or pending special assessments — roof, HVAC, plumbing, elevator, façade? What's the per-unit balance and payoff schedule, and is the seller paying it off at close or rolling it to the buyer?
- Is there a deadline driving the sale (1031 exchange, divorce, estate, relocation)? That informs how much negotiation room exists.
- What's the average days-on-market for RENTAL listings here right now (not sales)? A rising rental-DOM trend means longer vacancies and softer asking-rent achievability than the comps imply.
- What's the recent tenant-quality profile in this submarket — average credit score on applications, eviction rate, late-payment / NSF rate, and stable-employment percentage? A property-management company in the area should have these aggregated.
- How much new apartment / multifamily construction is in the pipeline within 1–3 miles? Heavy new supply (>2% of stock underway) typically softens rents 12–24 months out; light construction supports rent growth.
Repairs flagged (vision-AI assessment)
- Moderate: kitchen cabinets — dated and worn
- Major: bathroom carpet — poor condition and dated color
- Moderate: interior walls/paint — dated colors and wear
CashFlowRE · CFR-45DPZ5365FK2RS
· Data 2 weeks ago
cashflowre.app · 2026-05-29