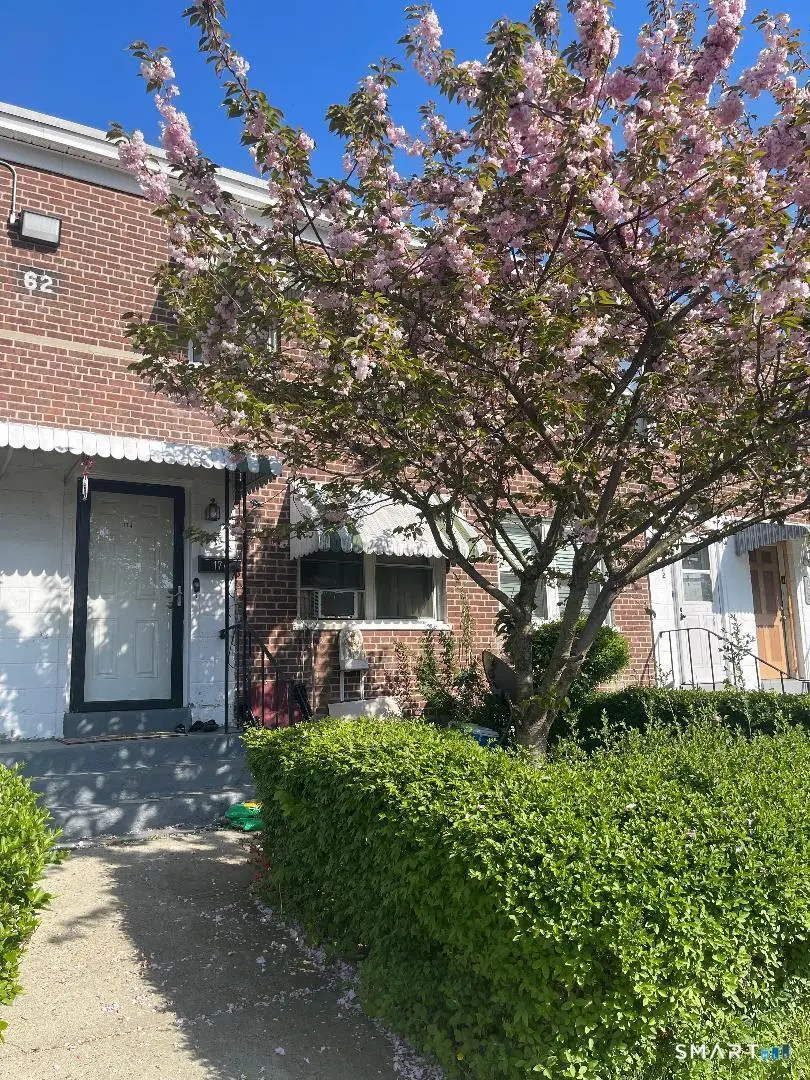
174 CourtD, BLD62 Success Ave
Bridgeport, CT 06610
$68,900B-
2 bd · 1.0 ba ·
622 sqft ·
Built 1941
· Condo
· Active
· 6 DOM
Cashflow @ list (25.0% down · 7.5%)
Estimated rent
$1,756/mo
Mortgage (P&I)
−$361
Tax + insurance
−$115
HOA
−$668
Vac / Maint / Mgmt
−$369
Net cashflow
$243/mo
Annual
$2,914/yr
Cap rate
10.52%
Cash-on-cash
15.10%
DSCR
1.67
1% rule
2.55%
Cash to close
$19,292
Investor read
- This is a 2-bed/1.0-bath condo listed at $69k. Condition is rated fair.
- At list price, monthly cash flow is $243 ($3k/yr) — positive.
- The deal already cash-flows at list — no discount required.
- Meets the 1% rule at list price ($2k rent vs $69k).
- Only 6 days on market — expect competitive offers; lowballing is unlikely to land.
- Local home prices are declining (-3.0%/yr); year-one equity from $476 of loan paydown is wiped out by about $2k of value loss. Plan a longer hold.
- Location reads 81/100 on livability (#15 in CT, #1,374 nationally) — a professional / high-income tenant draw. Strengths: amenities A+, commute A+, health & safety A+; Watch: crime C-, employment D+, schools D-.
- Bridgeport School District (urban): math 9% / reading 19% proficiency, ranked #151 of 153 in CT (top 99%) — low school quality limits family demand, transient renter base, plan for 1-2y turnover; 97% free/reduced lunch — lower-income household profile, screen leases tightly.
- Watch-outs: HOA is 38% of rent; built in 1941 — expect roof / HVAC / electrical / plumbing capex.
- Market conditions: 68 active listings in the ZIP; 22 comparable units currently listed for rent nearby; rentals at typical pace (median 20d on market — plan ~3-4 weeks tenant-placement turnaround); 852 units permitted in Greater Bridgeport Planning Region in 2024 (698 in 5+ unit buildings).
- At projected returns (-3.0% appreciation + 3.0% rent growth), your $19k cash investment doubles in ~8 years — after that, you're playing with house money.
- Climate carrying-cost: major wind risk, 51% chance of damaging wind over 30y; extreme-heat days projected 7→15/yr by 2055 (HVAC capex compounding) — expect insurance premiums to compound above CPI over the hold.
- Cap rate 10.5% vs local median 5.0% in Bridgeport — top-decile yield for the area; either an underpriced asset or a hidden risk that comps aren't pricing in. Stress-test before assuming the spread holds.
- This rent runs 41% of the median local income ($52k/yr) — at the standard rent-burdened threshold; future hikes will face affordability resistance.
Questions for listing agent
- Have any recent inspections been done? Can we get a copy of the seller's disclosures and any deferred-maintenance estimates?
- Built in 1941 — when were the roof, HVAC, electrical panel, plumbing, and water heater last replaced?
- What does the HOA fee cover, when was the last increase, and are there any pending special assessments or reserve-fund shortfalls?
- Any open or pending special assessments — roof, HVAC, plumbing, elevator, façade? What's the per-unit balance and payoff schedule, and is the seller paying it off at close or rolling it to the buyer?
- Is there a deadline driving the sale (1031 exchange, divorce, estate, relocation)? That informs how much negotiation room exists.
- Schools are D-rated, which usually means shorter tenancies and higher turnover. Who's the typical renter profile here, and what's been the actual vacancy rate?
- What's the average days-on-market for RENTAL listings here right now (not sales)? A rising rental-DOM trend means longer vacancies and softer asking-rent achievability than the comps imply.
- What's the recent tenant-quality profile in this submarket — average credit score on applications, eviction rate, late-payment / NSF rate, and stable-employment percentage? A property-management company in the area should have these aggregated.
Repairs flagged (vision-AI assessment)
- Major: Kitchen cabinets — Worn and dated
- Major: Bathroom fixtures — Dated and worn
- Minor: Paint — Some wear
CashFlowRE · CFR-461SAPA5GGFRMM
· Data 2 days ago
cashflowre.app · 2026-05-29