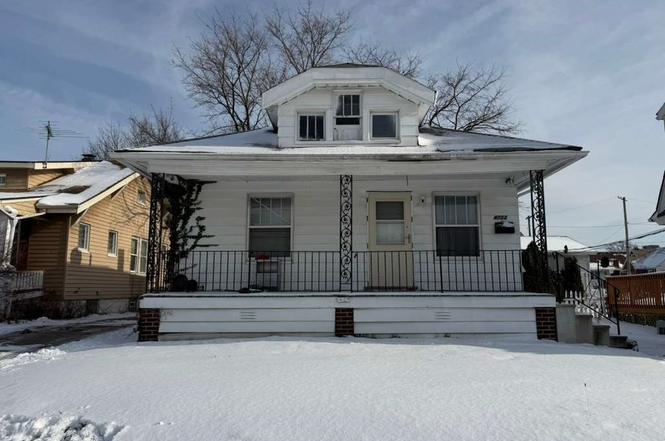
4723 E 94th St
Garfield Heights, OH 44125
$80,000B-
2 bd · 1.0 ba ·
824 sqft ·
Built 1924
· SingleFamily
· Pending
· 128 DOM
Cashflow @ list (25.0% down · 7.5%)
Estimated rent
$1,266/mo
Mortgage (P&I)
−$420
Tax + insurance
−$236
HOA
−$0
Vac / Maint / Mgmt
−$266
Net cashflow
$345/mo
Annual
$4,135/yr
Cap rate
11.46%
Cash-on-cash
18.46%
DSCR
1.82
1% rule
1.58%
Cash to close
$22,400
Investor read
- This is a 2-bed/1.0-bath single-family listed at $80k.
- At list price, monthly cash flow is $345 ($4k/yr) — positive.
- The deal already cash-flows at list — no discount required.
- Meets the 1% rule at list price ($1k rent vs $80k).
- It's been on market 128 days — a 12% lower offer ($70k) is reasonable based on typical stale-listing flexibility.
- Recommended offer: $70k (12.0% below list) — sets the bar for market timing.
- Local home prices are declining (-3.0%/yr); year-one equity from $553 of loan paydown is wiped out by about $2k of value loss. Plan a longer hold.
- Location reads 67/100 on livability (#593 in OH) — a middle-class / working-renter tenant base. Strengths: cost of living A+, housing A+, health & safety A; Watch: schools C-, crime D-, amenities F.
- Garfield Heights City Schools (suburban): math 8% / reading 22% proficiency, ranked #643 of 656 in OH (top 98%) — low school quality limits family demand, transient renter base, plan for 1-2y turnover; 64% free/reduced lunch — lower-income household profile, screen leases tightly.
- Watch-outs: property tax is 3.0% of price; built in 1924 — expect roof / HVAC / electrical / plumbing capex.
- Market conditions: Rents rising fast (+4.8%/yr); 120 active listings in the ZIP; 19 comparable units currently listed for rent nearby; rentals at typical pace (median 17d on market — plan ~3-4 weeks tenant-placement turnaround); 1,441 units permitted in Cuyahoga County in 2024 (700 in 5+ unit buildings).
- Cuyahoga County population projected to shrink 8% by 2050 — rents likely to lag national; underwrite the cash flow, not the appreciation.
- 7 sale attempts since 11y ago; this cycle's ask has dropped $10k (11%) from the opening price — seller is motivated, your offer sets the floor, not the list.
- Current owner paid $35k; list at $80k implies a 129% gain — meaningful room to come down on a strong offer.
- At projected returns (-3.0% appreciation + 4.8% rent growth), your $22k cash investment doubles in ~6 years — after that, you're playing with house money.
- Cap rate 11.5% vs local median 6.8% in Garfield Heights — top-decile yield for the area; either an underpriced asset or a hidden risk that comps aren't pricing in. Stress-test before assuming the spread holds.
Questions for listing agent
- It's been on market 128 days. Have you received any prior offers? Is the seller open to a 12% concession, seller financing, or rate buy-down credit?
- Built in 1924 — when were the roof, HVAC, electrical panel, plumbing, and water heater last replaced?
- Property tax is high relative to price — has the assessment been appealed recently, and will the sale trigger a re-assessment?
- Why hasn't it sold? Are there any deal-killer items the seller is aware of (foundation, flood, title, zoning, code violations)?
- Is there a deadline driving the sale (1031 exchange, divorce, estate, relocation)? That informs how much negotiation room exists.
- Crime grade is D in this area — have there been break-ins, vandalism, or insurance claims at this property in the last 3 years? What carrier currently insures it and at what premium?
- What's the average days-on-market for RENTAL listings here right now (not sales)? A rising rental-DOM trend means longer vacancies and softer asking-rent achievability than the comps imply.
- What's the recent tenant-quality profile in this submarket — average credit score on applications, eviction rate, late-payment / NSF rate, and stable-employment percentage? A property-management company in the area should have these aggregated.
CashFlowRE · CFR-46VMWZ37F0N4GC
· Data 2 weeks ago
cashflowre.app · 2026-05-29