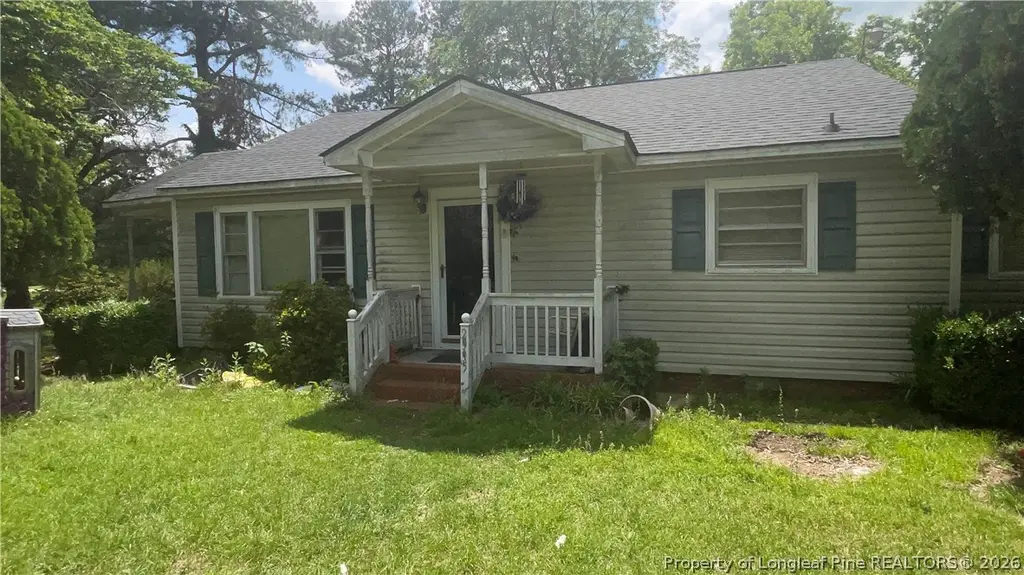
2995 Coleman Rd
Eastover, NC 28312
$111,900B+
3 bd · 1.0 ba ·
1,080 sqft ·
Built 1955
· SingleFamily
· Active
· 11 DOM
Cashflow @ list (25.0% down · 7.5%)
Estimated rent
$1,758/mo
Mortgage (P&I)
−$587
Tax + insurance
−$228
HOA
−$0
Vac / Maint / Mgmt
−$369
Net cashflow
$573/mo
Annual
$6,878/yr
Cap rate
13.15%
Cash-on-cash
24.50%
DSCR
2.09
1% rule
1.57%
Cash to close
$31,332
Investor read
- This is a 3-bed/1.0-bath single-family listed at $112k.
- At list price, monthly cash flow is $573 ($7k/yr) — positive.
- The deal already cash-flows at list — no discount required.
- Meets the 1% rule at list price ($2k rent vs $112k).
- Only 11 days on market — expect competitive offers; lowballing is unlikely to land.
- In year one you build about $12k of equity ($774 loan paydown + $11k appreciation (10.0% local appreciation)).
- Location reads 67/100 on livability (#228 in NC) — a middle-class / working-renter tenant base. Strengths: crime A+, housing A+, cost of living A; Watch: employment C-, amenities F, commute F.
- Cumberland County Schools (urban): math 32% / reading 41% proficiency, ranked #126 of 178 in NC (top 71%) — families likely to look elsewhere, expect single-tenant / working-renter base with shorter leases.
- Zoned schools: Mac Williams Middle (math 40% / reading 50%, grade D, #160 of 475 statewide, top 35%, 1,151 students, 58% FRL); Cape Fear High (math 75% / reading 47%, grade C+, #202 of 535 statewide, top 39%, 1,529 students, 50% FRL) — zoned schools at 54% FRL track the district average.
- Zoned-school proficiency averages 53% at this address vs 36% district-wide (+16 pts) — the actual schools serving this property are materially stronger than the Cumberland County Schools average implies; a family-tenant draw the district grade alone would hide.
- Watch-outs: flood insurance adds $66/mo; built in 1955 — expect roof / HVAC / electrical / plumbing capex.
- Market conditions: 222 active listings in the ZIP; 1,125 units permitted in Cumberland County in 2024 (104 in 5+ unit buildings).
- At projected returns (10.0% appreciation + 3.0% rent growth), your $31k cash investment doubles in ~2 years — after that, you're playing with house money.
- By year 3, paydown + projected appreciation supports a ~$30k cash-out refi (75% LTV) — recoverable capital for the next deal without selling this one.
- Climate carrying-cost: major flood risk; severe wind risk, 80% chance of damaging wind over 30y; major wildfire risk; extreme-heat days projected 7→16/yr by 2055 (HVAC capex compounding) — expect insurance premiums to compound above CPI over the hold.
- Cap rate 13.2% vs local median 3.0% in Eastover — top-decile yield for the area; either an underpriced asset or a hidden risk that comps aren't pricing in. Stress-test before assuming the spread holds.
Questions for listing agent
- Built in 1955 — when were the roof, HVAC, electrical panel, plumbing, and water heater last replaced?
- What's the actual annual flood-insurance premium (NFIP or private), and is the property in a SFHA with mandatory coverage?
- Is there a deadline driving the sale (1031 exchange, divorce, estate, relocation)? That informs how much negotiation room exists.
- What's the average days-on-market for RENTAL listings here right now (not sales)? A rising rental-DOM trend means longer vacancies and softer asking-rent achievability than the comps imply.
- What's the recent tenant-quality profile in this submarket — average credit score on applications, eviction rate, late-payment / NSF rate, and stable-employment percentage? A property-management company in the area should have these aggregated.
- How much new for-sale + rental construction is in the pipeline within 1–3 miles? Heavy new supply typically softens prices + rents 12–24 months out; constrained supply supports both.
CashFlowRE · CFR-49BVC67S0BHFJR
· Data 2 days ago
cashflowre.app · 2026-05-29