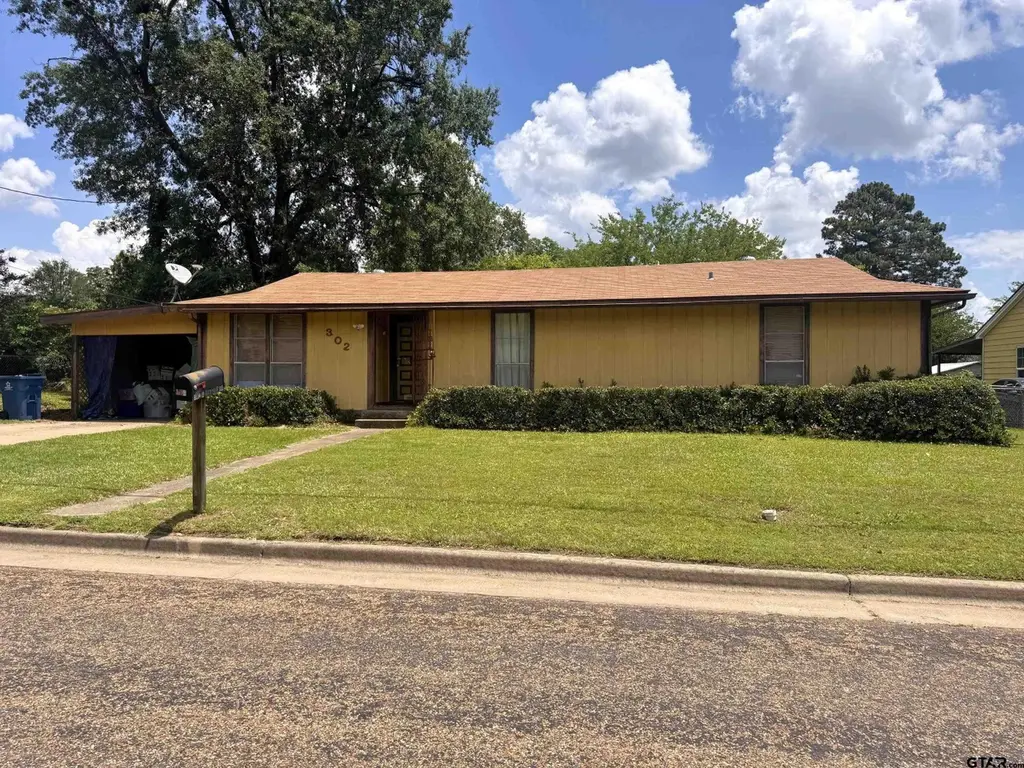
302 N O'tyson
Mount Pleasant, TX 75455
$155,000C
3 bd · 2.0 ba ·
1,232 sqft ·
Built 1973
· SingleFamily
· Active
· 17 DOM
Cashflow @ list (25.0% down · 7.5%)
Estimated rent
$1,498/mo
Mortgage (P&I)
−$813
Tax + insurance
−$209
HOA
−$0
Vac / Maint / Mgmt
−$314
Net cashflow
$162/mo
Annual
$1,939/yr
Cap rate
7.54%
Cash-on-cash
4.47%
DSCR
1.20
1% rule
0.97%
Cash to close
$43,400
Investor read
- This is a 3-bed/2.0-bath single-family listed at $155k.
- At list price, monthly cash flow is $162 ($2k/yr) — positive.
- The deal already cash-flows at list — no discount required.
- To meet the 1% rule (rent ≥ 1% of price), the offer needs to be $150k (3.4% below list).
- It's been on market 17 days — a 2% lower offer ($153k) is reasonable based on typical stale-listing flexibility.
- Recommended offer: $150k (3.4% below list) — sets the bar for 1% rule.
- Local home prices are declining (-3.0%/yr); year-one equity from $1k of loan paydown is wiped out by about $5k of value loss. Plan a longer hold.
- Location reads 77/100 on livability (#81 in TX, #2,808 nationally) — a middle-class / working-renter tenant base. Strengths: cost of living A+, housing A+, health & safety A+; Watch: employment C-, amenities D-, commute F.
- Mount Pleasant ISD (town): math 45% / reading 44% proficiency, ranked #291 of 826 in TX (top 35%) — families likely to look elsewhere, expect single-tenant / working-renter base with shorter leases; 74% free/reduced lunch — lower-income household profile, screen leases tightly.
- Zoned schools: Vivian Fowler El (math 47% / reading 37%, grade F, #1,335 of 4,322 statewide, top 33%, 404 students, 90% FRL); Mount Pleasant J H (math 40% / reading 45%, grade D-, #553 of 1,662 statewide, top 34%, 760 students, 81% FRL); Mount Pleasant H S (math 68% / reading 54%, grade C+, #258 of 1,632 statewide, top 16%, 1,521 students, 79% FRL).
- Market conditions: 382 active listings in the ZIP; 4 comparable units currently listed for rent nearby; rentals at typical pace (median 22d on market — plan ~3-4 weeks tenant-placement turnaround); 47 units permitted in Titus County in 2024 (10 in 5+ unit buildings).
- Climate carrying-cost: major wind risk, 27% chance of damaging wind over 30y; moderate wildfire risk; extreme-heat days projected 7→23/yr by 2055 (HVAC capex compounding) — expect insurance premiums to compound above CPI over the hold.
- Cap rate 7.5% vs local median 3.5% in Mount Pleasant — top-decile yield for the area; either an underpriced asset or a hidden risk that comps aren't pricing in. Stress-test before assuming the spread holds.
- This rent runs 32% of the median local income ($56k/yr) — at the standard rent-burdened threshold; future hikes will face affordability resistance.
Questions for listing agent
- Built in 1973 — when were the roof, HVAC, electrical panel, plumbing, and water heater last replaced?
- Is there a deadline driving the sale (1031 exchange, divorce, estate, relocation)? That informs how much negotiation room exists.
- Schools are D-rated, which usually means shorter tenancies and higher turnover. Who's the typical renter profile here, and what's been the actual vacancy rate?
- What's the average days-on-market for RENTAL listings here right now (not sales)? A rising rental-DOM trend means longer vacancies and softer asking-rent achievability than the comps imply.
- What's the recent tenant-quality profile in this submarket — average credit score on applications, eviction rate, late-payment / NSF rate, and stable-employment percentage? A property-management company in the area should have these aggregated.
- How much new for-sale + rental construction is in the pipeline within 1–3 miles? Heavy new supply typically softens prices + rents 12–24 months out; constrained supply supports both.
CashFlowRE · CFR-4CQ2XR7020JP8C
· Data 2 days ago
cashflowre.app · 2026-05-29