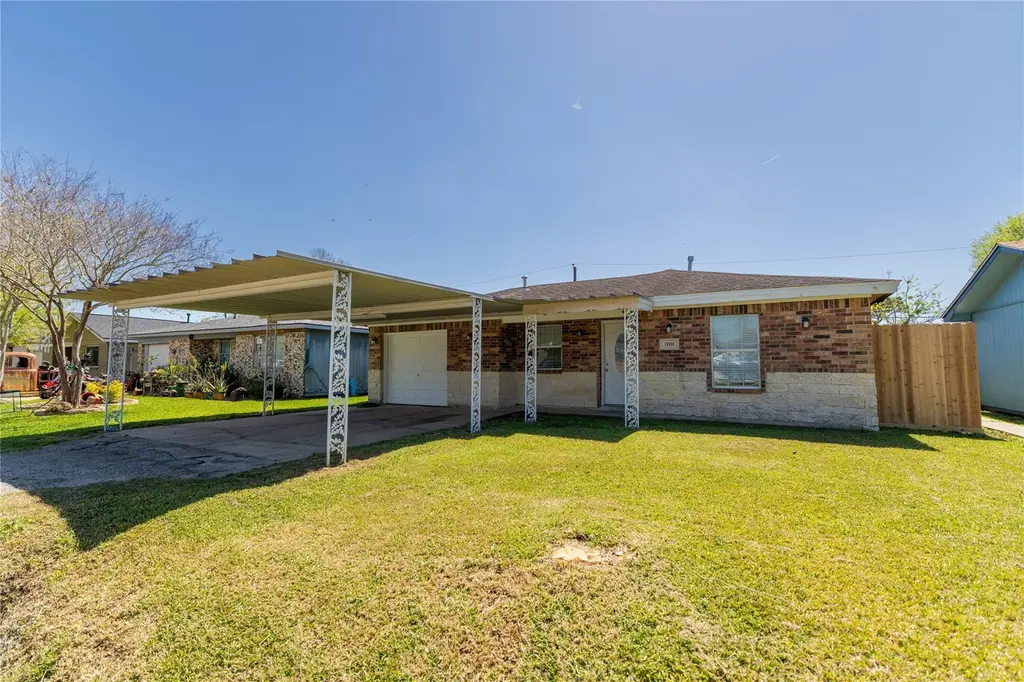
11810 Fieldcrest Dr
La Porte, TX 77571
$224,900D
3 bd · 1.5 ba ·
1,215 sqft ·
Built 1976
· SingleFamily
· Pending
· 11 DOM
Cashflow @ list (25.0% down · 7.5%)
Estimated rent
$2,074/mo
Mortgage (P&I)
−$1,179
Tax + insurance
−$493
HOA
−$0
Vac / Maint / Mgmt
−$436
Net cashflow
$-34/mo
Annual
$-413/yr
Cap rate
6.46%
Cash-on-cash
0.61%
DSCR
1.03
1% rule
0.92%
Cash to close
$62,972
Investor read
- This is a 3-bed/1.5-bath single-family listed at $225k.
- At list price, monthly cash flow is $-34 ($-413/yr) — negative.
- To cash-flow at today's rent, offer at most $219k (2.7% below list).
- To meet the 1% rule (rent ≥ 1% of price), the offer needs to be $207k (7.8% below list).
- Only 11 days on market — expect competitive offers; lowballing is unlikely to land.
- Recommended offer: $207k (7.8% below list) — sets the bar for 1% rule.
- Local home prices are declining (-3.0%/yr); year-one equity from $2k of loan paydown is wiped out by about $7k of value loss. Plan a longer hold.
- Location reads 70/100 on livability (#360 in TX) — a middle-class / working-renter tenant base. Strengths: cost of living A+, housing A+, crime A-; Watch: amenities F, commute F, health & safety F.
- La Porte ISD (suburban): math 41% / reading 44% proficiency, ranked #260 of 826 in TX (top 32%) — families likely to look elsewhere, expect single-tenant / working-renter base with shorter leases.
- Zoned schools: La Porte H S (math 24% / reading 46%, grade F, #954 of 1,632 statewide, top 59%, 2,069 students, 51% FRL).
- Watch-outs: flood insurance adds $66/mo.
- Market conditions: Rents rising (+2.8%/yr); 337 active listings in the ZIP; 1 comparable units currently listed for rent nearby; solid renter incomes; 29,883 units permitted in Harris County in 2024 (8,621 in 5+ unit buildings).
- Harris County population projected at +47% by 2050 — long-run rental-demand tailwind backs the buy-and-hold thesis.
- Climate carrying-cost: major flood risk; severe wind risk, 99% chance of damaging wind over 30y; extreme-heat days projected 7→25/yr by 2055 (HVAC capex compounding) — expect insurance premiums to compound above CPI over the hold.
- Cap rate 6.5% vs local median 3.4% in La Porte — top-decile yield for the area; either an underpriced asset or a hidden risk that comps aren't pricing in. Stress-test before assuming the spread holds.
- This rent runs 30% of the median local income ($82k/yr) — at the standard rent-burdened threshold; future hikes will face affordability resistance.
Questions for listing agent
- What do current leases actually rent for vs. the listed asking? Can we see a recent rent roll and the last 12 months of T-12 income?
- Built in 1976 — when were the roof, HVAC, electrical panel, plumbing, and water heater last replaced?
- What's the actual annual flood-insurance premium (NFIP or private), and is the property in a SFHA with mandatory coverage?
- Is there a deadline driving the sale (1031 exchange, divorce, estate, relocation)? That informs how much negotiation room exists.
- Schools are D-rated, which usually means shorter tenancies and higher turnover. Who's the typical renter profile here, and what's been the actual vacancy rate?
- The area grade is low — what's the realistic commute time and amenity access for the typical tenant pool here? Any planned neighborhood developments (good or bad) we should know about?
- What's the average days-on-market for RENTAL listings here right now (not sales)? A rising rental-DOM trend means longer vacancies and softer asking-rent achievability than the comps imply.
- What's the recent tenant-quality profile in this submarket — average credit score on applications, eviction rate, late-payment / NSF rate, and stable-employment percentage? A property-management company in the area should have these aggregated.
CashFlowRE · CFR-4D02QX95WDPWE1
· Data 3 weeks ago
cashflowre.app · 2026-05-29