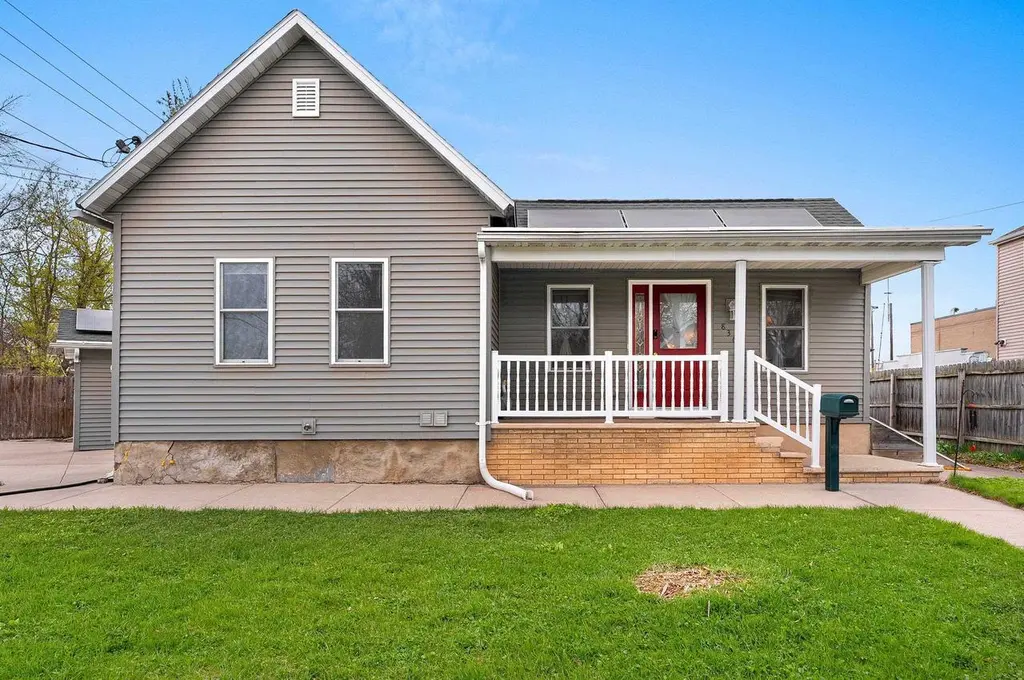
836 W 8th St
Appleton, WI 54914
$199,900D
3 bd · 2.5 ba ·
960 sqft ·
Built 1870
· SingleFamily
· Pending
· 27 DOM
Cashflow @ list (25.0% down · 7.5%)
Estimated rent
$1,587/mo
Mortgage (P&I)
−$1,048
Tax + insurance
−$259
HOA
−$0
Vac / Maint / Mgmt
−$333
Net cashflow
$-54/mo
Annual
$-647/yr
Cap rate
5.97%
Cash-on-cash
-1.16%
DSCR
0.95
1% rule
0.79%
Cash to close
$55,972
Investor read
- This is a 3-bed/2.5-bath single-family listed at $200k.
- At list price, monthly cash flow is $-54 ($-647/yr) — negative.
- To cash-flow at today's rent, offer at most $190k (4.8% below list).
- To meet the 1% rule (rent ≥ 1% of price), the offer needs to be $159k (20.6% below list).
- It's been on market 27 days — a 2% lower offer ($197k) is reasonable based on typical stale-listing flexibility.
- Recommended offer: $159k (20.6% below list) — sets the bar for 1% rule.
- Local home prices are declining (-3.0%/yr); year-one equity from $1k of loan paydown is wiped out by about $6k of value loss. Plan a longer hold.
- Location reads 82/100 on livability (#44 in WI, #1,073 nationally) — a professional / high-income tenant draw. Strengths: commute A+, cost of living A+, housing A+; Watch: amenities C-.
- Appleton Area School District (urban): math 33% / reading 36% proficiency, ranked #224 of 342 in WI (top 66%) — families likely to look elsewhere, expect single-tenant / working-renter base with shorter leases.
- Watch-outs: built in 1870 — expect roof / HVAC / electrical / plumbing capex.
- Market conditions: Rents rising fast (+7.8%/yr); 54 active listings in the ZIP; 10 comparable units currently listed for rent nearby; rentals at typical pace (median 15d on market — plan ~3-4 weeks tenant-placement turnaround); solid renter incomes; 460 units permitted in Outagamie County in 2024 (30 in 5+ unit buildings).
- Outagamie County population projected at +8% by 2050 — modest demand growth; plan on rents tracking national, not racing it.
- Cap rate 6.0% vs local median 3.8% in Appleton — top-decile yield for the area; either an underpriced asset or a hidden risk that comps aren't pricing in. Stress-test before assuming the spread holds.
Questions for listing agent
- What do current leases actually rent for vs. the listed asking? Can we see a recent rent roll and the last 12 months of T-12 income?
- Built in 1870 — when were the roof, HVAC, electrical panel, plumbing, and water heater last replaced?
- Is there a deadline driving the sale (1031 exchange, divorce, estate, relocation)? That informs how much negotiation room exists.
- The area grade is low — what's the realistic commute time and amenity access for the typical tenant pool here? Any planned neighborhood developments (good or bad) we should know about?
- What's the average days-on-market for RENTAL listings here right now (not sales)? A rising rental-DOM trend means longer vacancies and softer asking-rent achievability than the comps imply.
- What's the recent tenant-quality profile in this submarket — average credit score on applications, eviction rate, late-payment / NSF rate, and stable-employment percentage? A property-management company in the area should have these aggregated.
- How much new for-sale + rental construction is in the pipeline within 1–3 miles? Heavy new supply typically softens prices + rents 12–24 months out; constrained supply supports both.
CashFlowRE · CFR-4EF26P88TE6X34
· Data 3 weeks ago
cashflowre.app · 2026-05-29