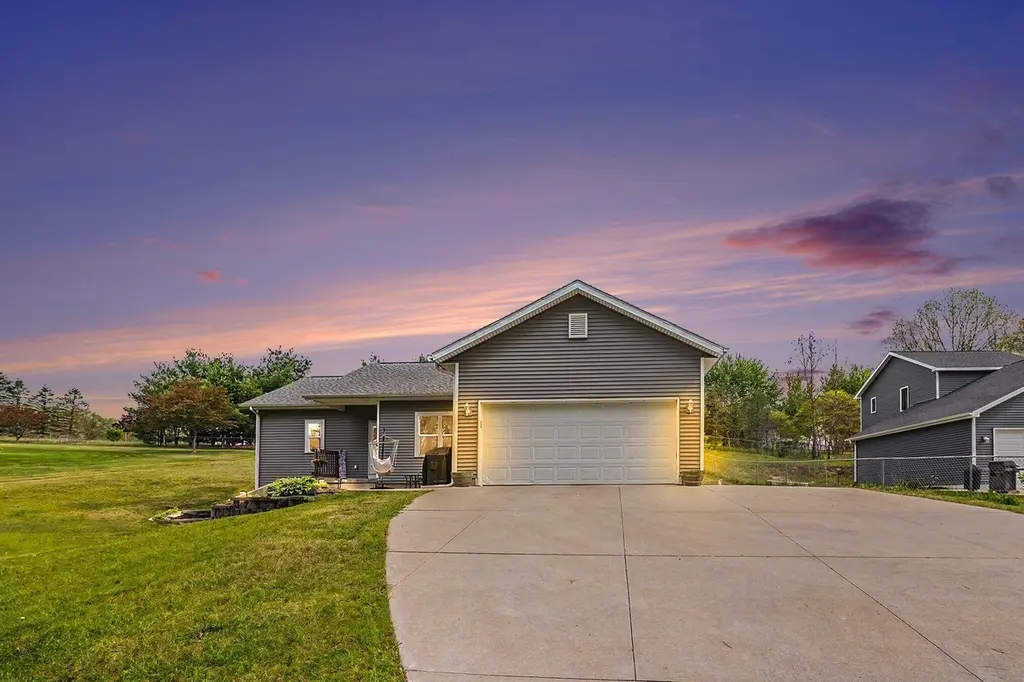
31800 Pine Ridge Cir
Lawton, MI 49065
$350,000F
4 bd · 2.5 ba ·
1,300 sqft ·
Built 2016
· SingleFamily
· Active
· 32 DOM
Cashflow @ list (25.0% down · 7.5%)
Estimated rent
$2,337/mo
Mortgage (P&I)
−$1,835
Tax + insurance
−$306
HOA
−$0
Vac / Maint / Mgmt
−$491
Net cashflow
$-295/mo
Annual
$-3,542/yr
Cap rate
5.47%
Cash-on-cash
-2.93%
DSCR
0.87
1% rule
0.67%
Cash to close
$98,000
Investor read
- This is a 4-bed/2.5-bath single-family listed at $350k.
- At list price, monthly cash flow is $-295 ($-4k/yr) — negative.
- To cash-flow at today's rent, offer at most $298k (14.9% below list).
- To meet the 1% rule (rent ≥ 1% of price), the offer needs to be $234k (33.2% below list).
- It's been on market 32 days — a 3% lower offer ($340k) is reasonable based on typical stale-listing flexibility.
- Recommended offer: $234k (33.2% below list) — sets the bar for 1% rule.
- Local home prices are declining (-3.0%/yr); year-one equity from $2k of loan paydown is wiped out by about $10k of value loss. Plan a longer hold.
- Location reads 70/100 on livability (#293 in MI) — a middle-class / working-renter tenant base. Strengths: cost of living A+, housing A+, crime A-; Watch: amenities F, commute F, employment D-.
- Lawton Community School District (rural): math 27% / reading 45% proficiency, ranked #263 of 540 in MI (top 49%) — families likely to look elsewhere, expect single-tenant / working-renter base with shorter leases.
- Zoned schools: Lawton Elementary School (math 32% / reading 42%, grade F, #685 of 1,397 statewide, top 51%, 401 students, 55% FRL); Lawton Middle School (math 17% / reading 42%, grade F, #343 of 493 statewide, top 72%, 307 students, 61% FRL); Lawton High School (math 32% / reading 57%, grade F, #214 of 713 statewide, top 36%, 289 students, 47% FRL).
- Watch-outs: flood insurance adds $56/mo.
- Market conditions: 33 active listings in the ZIP; 165 units permitted in Van Buren County in 2024 (0 in 5+ unit buildings).
- Van Buren County population projected at -23% by 2050 — secular population decline; favor cash flow + early exit over multi-decade hold.
- 6 sale attempts since 6y ago with the ask held roughly flat each time — persistent listings suggest the price (not the market) is what's stuck; bring a comps-based counter.
- Current owner paid $235k; 49% above their basis — modest negotiation headroom, anchor on the comps not their cost.
- Climate carrying-cost: severe flood risk — expect insurance premiums to compound above CPI over the hold.
Questions for listing agent
- What do current leases actually rent for vs. the listed asking? Can we see a recent rent roll and the last 12 months of T-12 income?
- It's been on market 32 days. Have you received any prior offers? Is the seller open to a 33% concession, seller financing, or rate buy-down credit?
- What's the actual annual flood-insurance premium (NFIP or private), and is the property in a SFHA with mandatory coverage?
- Is there a deadline driving the sale (1031 exchange, divorce, estate, relocation)? That informs how much negotiation room exists.
- The area grade is low — what's the realistic commute time and amenity access for the typical tenant pool here? Any planned neighborhood developments (good or bad) we should know about?
- What's the average days-on-market for RENTAL listings here right now (not sales)? A rising rental-DOM trend means longer vacancies and softer asking-rent achievability than the comps imply.
- What's the recent tenant-quality profile in this submarket — average credit score on applications, eviction rate, late-payment / NSF rate, and stable-employment percentage? A property-management company in the area should have these aggregated.
- How much new for-sale + rental construction is in the pipeline within 1–3 miles? Heavy new supply typically softens prices + rents 12–24 months out; constrained supply supports both.
CashFlowRE · CFR-4EXPNZ8PZGP1DY
· Data 1 h ago
cashflowre.app · 2026-05-29