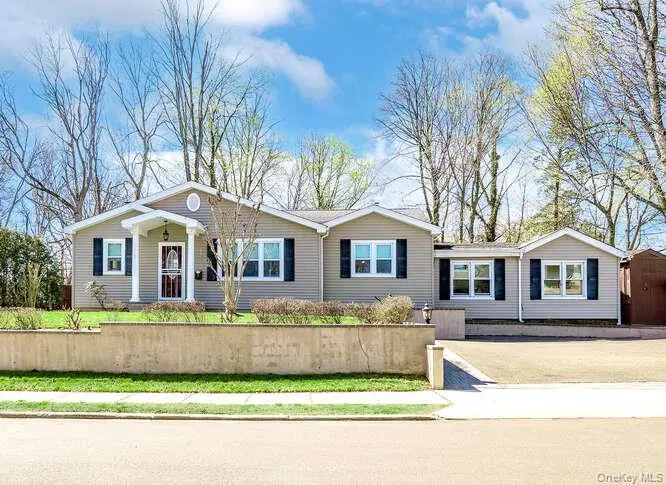
1 Roosevelt St
Glen Cove, NY 11542
$899,000C-
4 bd · 2.0 ba ·
1,756 sqft ·
Built 1950
· MultiFamily
· Pending
· 25 DOM
Cashflow @ list (25.0% down · 7.5%)
Estimated rent
$7,395/mo
Mortgage (P&I)
−$4,714
Tax + insurance
−$625
HOA
−$0
Vac / Maint / Mgmt
−$1,553
Net cashflow
$503/mo
Annual
$6,032/yr
Cap rate
6.96%
Cash-on-cash
2.40%
DSCR
1.11
1% rule
0.82%
Cash to close
$251,720
Investor read
- This is a 2 × 2-bed/1.0-bath units multifamily listed at $899k.
- At list price, monthly cash flow is $503 ($6k/yr) — positive. Per door: $251/mo.
- The deal already cash-flows at list — no discount required.
- To meet the 1% rule (rent ≥ 1% of price), the offer needs to be $740k (17.7% below list).
- It's been on market 25 days — a 2% lower offer ($886k) is reasonable based on typical stale-listing flexibility.
- Recommended offer: $740k (17.7% below list) — sets the bar for 1% rule.
- Local home prices are declining (-3.0%/yr); year-one equity from $6k of loan paydown is wiped out by about $27k of value loss. Plan a longer hold.
- Location reads 65/100 on livability (#685 in NY) — a middle-class / working-renter tenant base. Strengths: crime A+, employment A+; Watch: housing C-, amenities F, commute F.
- Glen Cove City School District (suburban): math 50% / reading 55% proficiency, ranked #312 of 590 in NY (top 53%) — acceptable for families but not a draw, mixed tenant base, ~2y average lease.
- Zoned schools: Robert M Finley Middle School (math 43% / reading 47%, grade D, #342 of 729 statewide, top 48%, 710 students, 70% FRL); Glen Cove High School (math 85% / reading 87%, grade A, #347 of 1,100 statewide, top 32%, 1,050 students, 55% FRL) — zoned schools average 62% FRL vs 45% district-wide (18 pts higher); higher-poverty schools than district average — tighter screening recommended.
- Zoned-school proficiency averages 66% at this address vs 52% district-wide (+13 pts) — the actual schools serving this property are materially stronger than the Glen Cove City School District average implies; a family-tenant draw the district grade alone would hide.
- Watch-outs: built in 1950 — expect roof / HVAC / electrical / plumbing capex.
- Market conditions: Rents rising fast (+6.4%/yr); 145 active listings in the ZIP; 21 comparable units currently listed for rent nearby; rentals at typical pace (median 21d on market — plan ~3-4 weeks tenant-placement turnaround); solid renter incomes; 824 units permitted in Nassau County in 2024 (153 in 5+ unit buildings).
- Nassau County population projected at +7% by 2050 — modest demand growth; plan on rents tracking national, not racing it.
- Climate carrying-cost: major flood risk; major wind risk, 56% chance of damaging wind over 30y; extreme-heat days projected 7→16/yr by 2055 (HVAC capex compounding) — expect insurance premiums to compound above CPI over the hold.
- Cap rate 7.0% vs local median 3.6% in Glen Cove — top-decile yield for the area; either an underpriced asset or a hidden risk that comps aren't pricing in. Stress-test before assuming the spread holds.
- At $7,395/mo this rent would consume 95% of the median local household income ($93k/yr) (locally 1667% of renters already pay >50% of income on rent) — very limited rent-growth headroom before tenants either downsize or default.
Questions for listing agent
- Can we see the unit-by-unit rent roll, current vacancy, and any below-market leases? What's the average tenancy length?
- What capital expenditures (roof, boiler, parking lot, exteriors) have been made in the last 5 years, and what's planned in the next 2?
- Built in 1950 — when were the roof, HVAC, electrical panel, plumbing, and water heater last replaced?
- Is there a deadline driving the sale (1031 exchange, divorce, estate, relocation)? That informs how much negotiation room exists.
- What's the average days-on-market for RENTAL listings here right now (not sales)? A rising rental-DOM trend means longer vacancies and softer asking-rent achievability than the comps imply.
- What's the recent tenant-quality profile in this submarket — average credit score on applications, eviction rate, late-payment / NSF rate, and stable-employment percentage? A property-management company in the area should have these aggregated.
- How much new apartment / multifamily construction is in the pipeline within 1–3 miles? Heavy new supply (>2% of stock underway) typically softens rents 12–24 months out; light construction supports rent growth.
CashFlowRE · CFR-4K25W03QNYVYYM
· Data 4 weeks ago
cashflowre.app · 2026-05-29