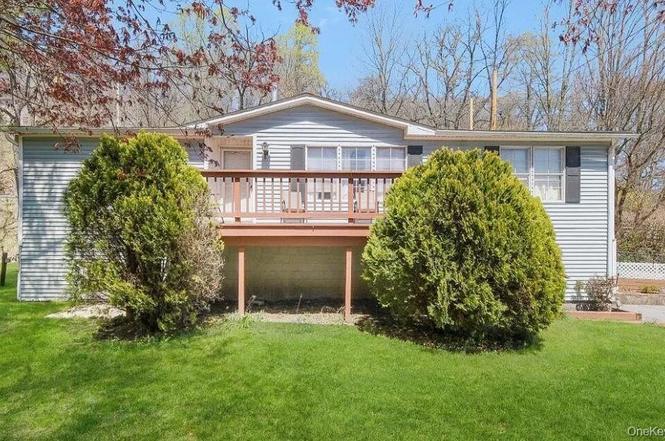
493 State Route 44-55
Clintondale, NY 12542
$339,000D+
3 bd · 2.0 ba ·
1,248 sqft ·
Built 1991
· SingleFamily
· Pending
· 13 DOM
Cashflow @ list (25.0% down · 7.5%)
Estimated rent
$2,541/mo
Mortgage (P&I)
−$1,778
Tax + insurance
−$712
HOA
−$0
Vac / Maint / Mgmt
−$534
Net cashflow
$-483/mo
Annual
$-5,792/yr
Cap rate
4.78%
Cash-on-cash
-5.40%
DSCR
0.76
1% rule
0.75%
Cash to close
$94,920
Investor read
- This is a 3-bed/2.0-bath single-family listed at $339k.
- At list price, monthly cash flow is $-483 ($-6k/yr) — negative.
- To cash-flow at today's rent, offer at most $254k (25.2% below list).
- To meet the 1% rule (rent ≥ 1% of price), the offer needs to be $254k (25.1% below list).
- Only 13 days on market — expect competitive offers; lowballing is unlikely to land.
- Recommended offer: $254k (25.2% below list) — sets the bar for cash-flow.
- In year one you build about $33k of equity ($2k loan paydown + $30k appreciation (9.0% local appreciation)).
- Location reads 64/100 on livability (#732 in NY) — a middle-class / working-renter tenant base. Strengths: crime A+, employment B+, housing B; Watch: cost of living D, amenities F, commute F.
- Highland Central School District (suburban): math 50% / reading 69% proficiency, ranked #227 of 590 in NY (top 38%) — acceptable for families but not a draw, mixed tenant base, ~2y average lease.
- Zoned schools: Highland Elementary School (math 46% / reading 67%, grade C+, #899 of 2,108 statewide, top 43%, 638 students, 38% FRL); Highland Middle School (math 27% / reading 57%, grade D-, #379 of 729 statewide, top 54%, 376 students, 42% FRL); Highland High School (math 87% / reading 92%, grade A+, #265 of 1,100 statewide, top 26%, 512 students, 41% FRL).
- Watch-outs: flood insurance adds $56/mo.
- Market conditions: 56 active listings in the ZIP; 2 comparable units currently listed for rent nearby; 464 units permitted in Ulster County in 2024 (170 in 5+ unit buildings).
- Ulster County population projected at -14% by 2050 — secular population decline; favor cash flow + early exit over multi-decade hold.
- 4 sale attempts since 9y ago with the ask held roughly flat each time — persistent listings suggest the price (not the market) is what's stuck; bring a comps-based counter.
- By year 2, paydown + projected appreciation supports a ~$53k cash-out refi (75% LTV) — recoverable capital for the next deal without selling this one.
- Climate carrying-cost: severe flood risk — expect insurance premiums to compound above CPI over the hold.
- Cap rate 4.8% vs local median 2.9% in Clintondale — top-decile yield for the area; either an underpriced asset or a hidden risk that comps aren't pricing in. Stress-test before assuming the spread holds.
Questions for listing agent
- What do current leases actually rent for vs. the listed asking? Can we see a recent rent roll and the last 12 months of T-12 income?
- What's the actual annual flood-insurance premium (NFIP or private), and is the property in a SFHA with mandatory coverage?
- Is there a deadline driving the sale (1031 exchange, divorce, estate, relocation)? That informs how much negotiation room exists.
- Schools are D-rated, which usually means shorter tenancies and higher turnover. Who's the typical renter profile here, and what's been the actual vacancy rate?
- The area grade is low — what's the realistic commute time and amenity access for the typical tenant pool here? Any planned neighborhood developments (good or bad) we should know about?
- What's the average days-on-market for RENTAL listings here right now (not sales)? A rising rental-DOM trend means longer vacancies and softer asking-rent achievability than the comps imply.
- What's the recent tenant-quality profile in this submarket — average credit score on applications, eviction rate, late-payment / NSF rate, and stable-employment percentage? A property-management company in the area should have these aggregated.
- How much new for-sale + rental construction is in the pipeline within 1–3 miles? Heavy new supply typically softens prices + rents 12–24 months out; constrained supply supports both.
CashFlowRE · CFR-4KQ37ZAZWEB3F8
· Data 4 weeks ago
cashflowre.app · 2026-05-29