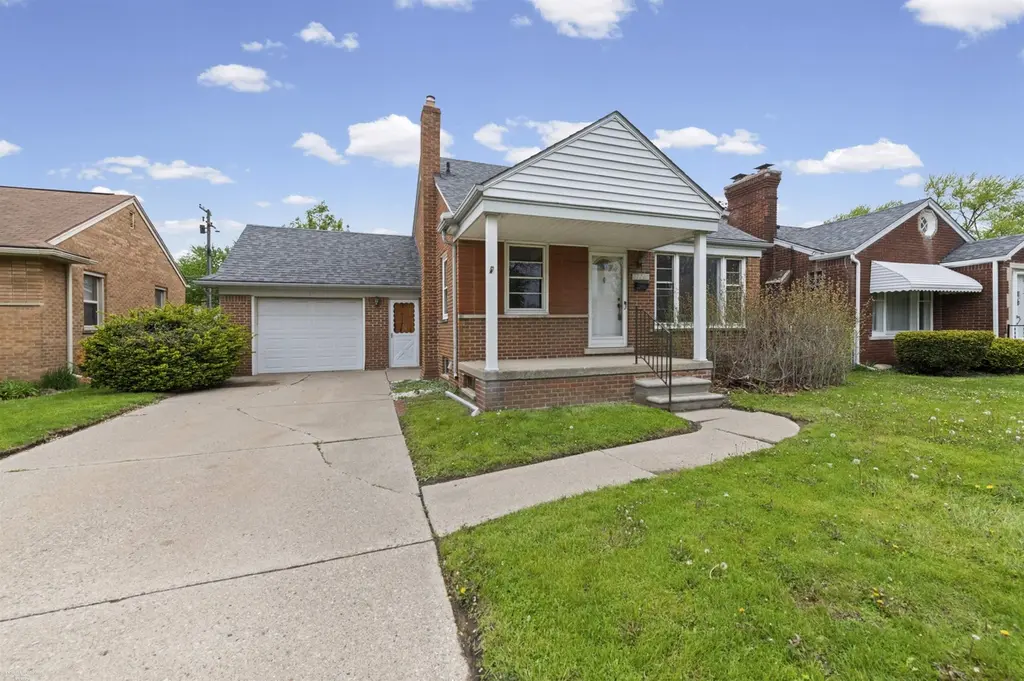
27207 Little Mack Ave
St. Clair Shores, MI 48081
$173,500D
3 bd · 1.0 ba ·
1,197 sqft ·
Built 1954
· SingleFamily
· Pending
· 12 DOM
Cashflow @ list (25.0% down · 7.5%)
Estimated rent
$1,429/mo
Mortgage (P&I)
−$910
Tax + insurance
−$259
HOA
−$0
Vac / Maint / Mgmt
−$300
Net cashflow
$-40/mo
Annual
$-478/yr
Cap rate
6.02%
Cash-on-cash
-0.98%
DSCR
0.96
1% rule
0.82%
Cash to close
$48,580
Investor read
- This is a 3-bed/1.0-bath single-family listed at $174k.
- At list price, monthly cash flow is $-40 ($-478/yr) — negative.
- To cash-flow at today's rent, offer at most $166k (4.1% below list).
- To meet the 1% rule (rent ≥ 1% of price), the offer needs to be $143k (17.6% below list).
- Only 12 days on market — expect competitive offers; lowballing is unlikely to land.
- Recommended offer: $143k (17.6% below list) — sets the bar for 1% rule.
- Local home prices are declining (-3.0%/yr); year-one equity from $1k of loan paydown is wiped out by about $5k of value loss. Plan a longer hold.
- Location reads: area grade D — affects rentability + tenant quality, not the cash-flow math above.
- Lakeview Public Schools (Macomb) (suburban): math 32% / reading 51% proficiency, ranked #180 of 540 in MI (top 33%) — families likely to look elsewhere, expect single-tenant / working-renter base with shorter leases.
- Zoned schools: Princeton Elementary School (math 40% / reading 54%, grade D-, #433 of 1,397 statewide, top 34%, 622 students, 46% FRL); Jefferson Middle School (math 33% / reading 52%, grade D-, #183 of 493 statewide, top 37%, 956 students, 50% FRL); Lakeview High School (math 30% / reading 64%, grade D-, #187 of 713 statewide, top 29%, 1,465 students, 42% FRL) — zoned schools average 46% FRL vs 31% district-wide (15 pts higher); higher-poverty schools than district average — tighter screening recommended.
- Watch-outs: built in 1954 — expect roof / HVAC / electrical / plumbing capex.
- Market conditions: 118 active listings in the ZIP; 11 comparable units currently listed for rent nearby; rentals at typical pace (median 26d on market — plan ~3-4 weeks tenant-placement turnaround); 1,321 units permitted in Macomb County in 2024 (86 in 5+ unit buildings).
- Macomb County population projected at +9% by 2050 — modest demand growth; plan on rents tracking national, not racing it.
- 2 sale attempts; this cycle's ask has dropped $11k (6%) from the opening price — seller is motivated, your offer sets the floor, not the list.
- Cap rate 6.0% vs local median 4.0% in St. Clair Shores — top-decile yield for the area; either an underpriced asset or a hidden risk that comps aren't pricing in. Stress-test before assuming the spread holds.
Questions for listing agent
- What do current leases actually rent for vs. the listed asking? Can we see a recent rent roll and the last 12 months of T-12 income?
- Built in 1954 — when were the roof, HVAC, electrical panel, plumbing, and water heater last replaced?
- Is there a deadline driving the sale (1031 exchange, divorce, estate, relocation)? That informs how much negotiation room exists.
- The area grade is low — what's the realistic commute time and amenity access for the typical tenant pool here? Any planned neighborhood developments (good or bad) we should know about?
- What's the average days-on-market for RENTAL listings here right now (not sales)? A rising rental-DOM trend means longer vacancies and softer asking-rent achievability than the comps imply.
- What's the recent tenant-quality profile in this submarket — average credit score on applications, eviction rate, late-payment / NSF rate, and stable-employment percentage? A property-management company in the area should have these aggregated.
- How much new for-sale + rental construction is in the pipeline within 1–3 miles? Heavy new supply typically softens prices + rents 12–24 months out; constrained supply supports both.
CashFlowRE · CFR-4RYPEHCV4DQYTZ
· Data 4 weeks ago
cashflowre.app · 2026-05-29