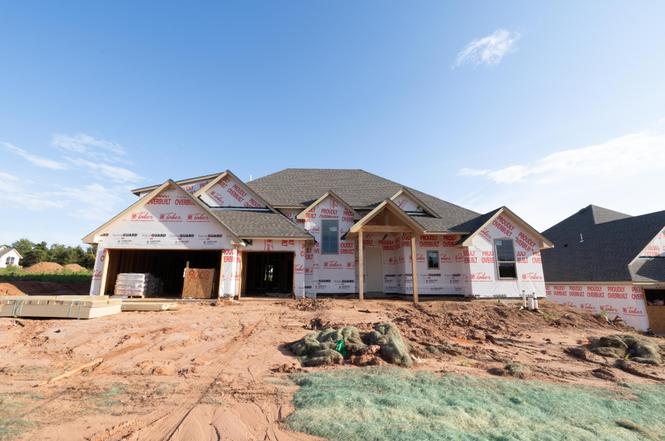
9008 Grey Joy Rd
Edmond, OK 73007
$599,340D-
4 bd · 3.0 ba ·
2,850 sqft ·
Built 2026
· SingleFamily
· Active
· 134 DOM
Cashflow @ list (25.0% down · 7.5%)
Estimated rent
$4,000/mo
Mortgage (P&I)
−$3,143
Tax + insurance
−$999
HOA
−$83
Vac / Maint / Mgmt
−$840
Net cashflow
$-1,065/mo
Annual
$-12,779/yr
Cap rate
4.16%
Cash-on-cash
-7.61%
DSCR
0.66
1% rule
0.67%
Cash to close
$167,815
Investor read
- This is a 4-bed/3.0-bath single-family listed at $599k.
- At list price, monthly cash flow is $-1k ($-13k/yr) — negative.
- To cash-flow at today's rent, offer at most $445k (25.7% below list).
- To meet the 1% rule (rent ≥ 1% of price), the offer needs to be $400k (33.3% below list).
- It's been on market 134 days — a 12% lower offer ($527k) is reasonable based on typical stale-listing flexibility.
- Recommended offer: $400k (33.3% below list) — sets the bar for 1% rule.
- In year one you build about $64k of equity ($4k loan paydown + $60k appreciation (10.0% local appreciation)).
- Location reads 78/100 on livability (#6 in OK, #2,383 nationally) — a middle-class / working-renter tenant base. Strengths: employment A+, housing A+, crime A-; Watch: health & safety C-, commute F.
- Edmond (suburban): math 38% / reading 40% proficiency, ranked #11 of 270 in OK (top 4%) — families likely to look elsewhere, expect single-tenant / working-renter base with shorter leases.
- Zoned schools: Redbud Es (616 students, 0% FRL); Memorial Hs (math 44% / reading 56%, grade D+, #4 of 447 statewide, top 1%, 2,605 students, 0% FRL) — zoned schools average 0% FRL vs 22% district-wide (22 pts lower); this property's tenant base skews higher-income than the district average.
- Market conditions: 192 active listings in the ZIP; 1 comparable units currently listed for rent nearby; 5,365 units permitted in Oklahoma County in 2024 (569 in 5+ unit buildings).
- Oklahoma County population projected at +41% by 2050 — long-run rental-demand tailwind backs the buy-and-hold thesis.
- 2 sale attempts with the ask held roughly flat each time — persistent listings suggest the price (not the market) is what's stuck; bring a comps-based counter.
- By year 2, paydown + projected appreciation supports a ~$103k cash-out refi (75% LTV) — recoverable capital for the next deal without selling this one.
- Cap rate 4.2% vs local median 3.4% in Edmond — meaningfully above typical; check what's discounted (condition, days-on-market, listing class) to confirm the premium yield is real.
Questions for listing agent
- What do current leases actually rent for vs. the listed asking? Can we see a recent rent roll and the last 12 months of T-12 income?
- It's been on market 134 days. Have you received any prior offers? Is the seller open to a 33% concession, seller financing, or rate buy-down credit?
- What does the HOA fee cover, when was the last increase, and are there any pending special assessments or reserve-fund shortfalls?
- Why hasn't it sold? Are there any deal-killer items the seller is aware of (foundation, flood, title, zoning, code violations)?
- Is there a deadline driving the sale (1031 exchange, divorce, estate, relocation)? That informs how much negotiation room exists.
- Schools are A-rated — typically a magnet for longer-tenancy family renters. What's the average tenant stay here, and is there a school-zone premium baked into asking?
- The area grade is low — what's the realistic commute time and amenity access for the typical tenant pool here? Any planned neighborhood developments (good or bad) we should know about?
- What's the average days-on-market for RENTAL listings here right now (not sales)? A rising rental-DOM trend means longer vacancies and softer asking-rent achievability than the comps imply.
CashFlowRE · CFR-4SR4DAB4GSBJQA
· Data 2 days ago
cashflowre.app · 2026-05-29