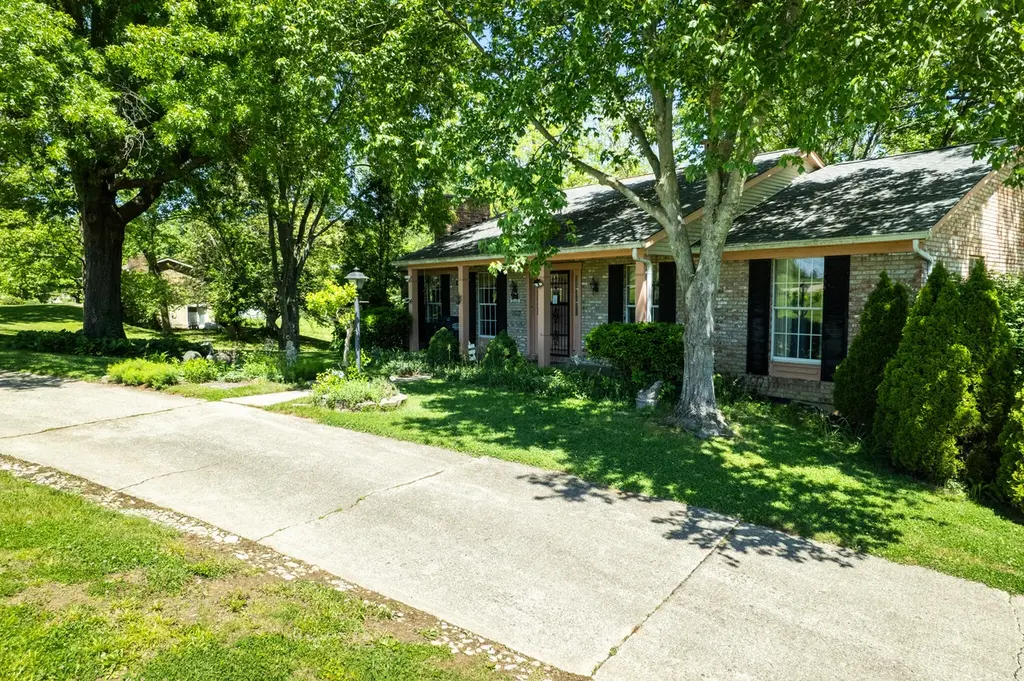
10626 Sedco Dr
Union, KY 41091
$150,000B-
3 bd · 2.5 ba ·
1,500 sqft ·
Built 1974
· SingleFamily
· Pending
· 20 DOM
Cashflow @ list (25.0% down · 7.5%)
Estimated rent
$2,136/mo
Mortgage (P&I)
−$787
Tax + insurance
−$244
HOA
−$0
Vac / Maint / Mgmt
−$448
Net cashflow
$656/mo
Annual
$7,875/yr
Cap rate
11.54%
Cash-on-cash
18.75%
DSCR
1.83
1% rule
1.42%
Cash to close
$42,000
Investor read
- This is a 3-bed/2.5-bath single-family listed at $150k.
- At list price, monthly cash flow is $656 ($8k/yr) — positive.
- The deal already cash-flows at list — no discount required.
- Meets the 1% rule at list price ($2k rent vs $150k).
- It's been on market 20 days — a 2% lower offer ($148k) is reasonable based on typical stale-listing flexibility.
- Recommended offer: $148k (1.5% below list) — sets the bar for market timing.
- Local home prices are declining (-3.0%/yr); year-one equity from $1k of loan paydown is wiped out by about $4k of value loss. Plan a longer hold.
- Location reads 78/100 on livability (#79 in KY, #2,521 nationally) — a middle-class / working-renter tenant base. Strengths: crime A+, employment A+, housing A+; Watch: amenities F, commute F.
- Boone County (suburban): math 43% / reading 49% proficiency, ranked #12 of 165 in KY (top 7%) — families likely to look elsewhere, expect single-tenant / working-renter base with shorter leases.
- Zoned schools: Shirley Mann Elementary School (math 63% / reading 65%, grade B, #21 of 676 statewide, top 3%, 717 students, 19% FRL); Gray Middle School (math 57% / reading 61%, grade B, #3 of 217 statewide, top 1%, 1,029 students, 27% FRL); Larry A. Ryle High School (math 50% / reading 48%, grade D, #15 of 254 statewide, top 6%, 2,013 students, 32% FRL) — zoned schools at 26% FRL track the district average.
- Market conditions: 474 active listings in the ZIP; 1,430 units permitted in Boone County in 2024 (928 in 5+ unit buildings).
- Boone County population projected at +24% by 2050 — long-run rental-demand tailwind backs the buy-and-hold thesis.
- At projected returns (-3.0% appreciation + 3.0% rent growth), your $42k cash investment doubles in ~7 years — after that, you're playing with house money.
- Cap rate 11.5% vs local median 2.4% in Union — top-decile yield for the area; either an underpriced asset or a hidden risk that comps aren't pricing in. Stress-test before assuming the spread holds.
Questions for listing agent
- Built in 1974 — when were the roof, HVAC, electrical panel, plumbing, and water heater last replaced?
- Is there a deadline driving the sale (1031 exchange, divorce, estate, relocation)? That informs how much negotiation room exists.
- Schools are A-rated — typically a magnet for longer-tenancy family renters. What's the average tenant stay here, and is there a school-zone premium baked into asking?
- What's the average days-on-market for RENTAL listings here right now (not sales)? A rising rental-DOM trend means longer vacancies and softer asking-rent achievability than the comps imply.
- What's the recent tenant-quality profile in this submarket — average credit score on applications, eviction rate, late-payment / NSF rate, and stable-employment percentage? A property-management company in the area should have these aggregated.
- How much new for-sale + rental construction is in the pipeline within 1–3 miles? Heavy new supply typically softens prices + rents 12–24 months out; constrained supply supports both.
CashFlowRE · CFR-4Y1BWHF0DSKNQ5
· Data 3 weeks ago
cashflowre.app · 2026-05-29