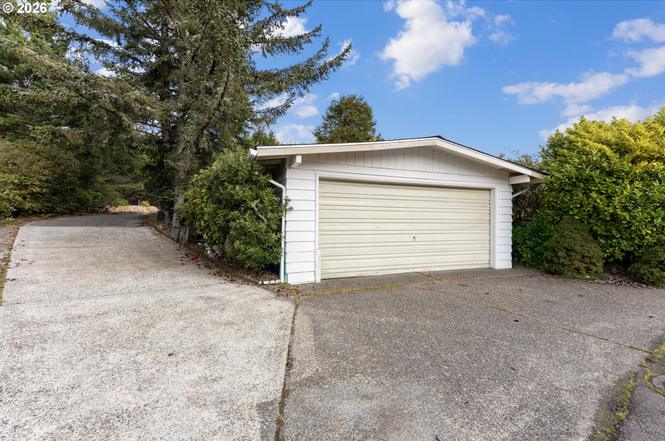
1600 Rhododendron Dr #415
Florence, OR 97439
$249,900D+
3 bd · 2.0 ba ·
1,440 sqft ·
Built 1977
· Manufactured
· Pending
· 43 DOM
Cashflow @ list (25.0% down · 7.5%)
Estimated rent
$1,895/mo
Mortgage (P&I)
−$1,311
Tax + insurance
−$267
HOA
−$335
Vac / Maint / Mgmt
−$398
Net cashflow
$-416/mo
Annual
$-4,986/yr
Cap rate
4.30%
Cash-on-cash
-7.13%
DSCR
0.68
1% rule
0.76%
Cash to close
$69,972
Investor read
- This is a 3-bed/2.0-bath manufactured listed at $250k.
- At list price, monthly cash flow is $-416 ($-5k/yr) — negative.
- To cash-flow at today's rent, offer at most $176k (29.4% below list).
- To meet the 1% rule (rent ≥ 1% of price), the offer needs to be $190k (24.2% below list).
- It's been on market 43 days — a 3% lower offer ($242k) is reasonable based on typical stale-listing flexibility.
- Recommended offer: $176k (29.4% below list) — sets the bar for cash-flow.
- In year one you build about $27k of equity ($2k loan paydown + $25k appreciation (10.0% local appreciation)).
- Location reads 70/100 on livability (#142 in OR) — a middle-class / working-renter tenant base. Strengths: health & safety A+, housing A, crime A-; Watch: employment C-, amenities F, commute F.
- Siuslaw SD 97J (town): math 33% / reading 50% proficiency, ranked #106 of 183 in OR (top 58%) — families likely to look elsewhere, expect single-tenant / working-renter base with shorter leases.
- Zoned schools: Siuslaw Elementary School (math 22% / reading 37%, grade F, #263 of 412 statewide, top 68%, 520 students, 68% FRL); Siuslaw Middle School (math 15% / reading 37%, grade F, #101 of 128 statewide, top 80%, 270 students, 68% FRL); Siuslaw High School (math 24% / reading 75%, grade D+, #32 of 143 statewide, top 34%, 459 students, 68% FRL).
- Market conditions: 406 active listings in the ZIP; 1 comparable units currently listed for rent nearby; 1,808 units permitted in Lane County in 2024 (972 in 5+ unit buildings).
- Lane County population projected at +15% by 2050 — long-run rental-demand tailwind backs the buy-and-hold thesis.
- Current owner paid $200k; 25% above their basis — modest negotiation headroom, anchor on the comps not their cost.
- By year 2, paydown + projected appreciation supports a ~$43k cash-out refi (75% LTV) — recoverable capital for the next deal without selling this one.
- Cap rate 4.3% vs local median 2.6% in Florence — top-decile yield for the area; either an underpriced asset or a hidden risk that comps aren't pricing in. Stress-test before assuming the spread holds.
Questions for listing agent
- What do current leases actually rent for vs. the listed asking? Can we see a recent rent roll and the last 12 months of T-12 income?
- It's been on market 43 days. Have you received any prior offers? Is the seller open to a 29% concession, seller financing, or rate buy-down credit?
- Built in 1977 — when were the roof, HVAC, electrical panel, plumbing, and water heater last replaced?
- What does the HOA fee cover, when was the last increase, and are there any pending special assessments or reserve-fund shortfalls?
- Is there a deadline driving the sale (1031 exchange, divorce, estate, relocation)? That informs how much negotiation room exists.
- The area grade is low — what's the realistic commute time and amenity access for the typical tenant pool here? Any planned neighborhood developments (good or bad) we should know about?
- What's the average days-on-market for RENTAL listings here right now (not sales)? A rising rental-DOM trend means longer vacancies and softer asking-rent achievability than the comps imply.
- What's the recent tenant-quality profile in this submarket — average credit score on applications, eviction rate, late-payment / NSF rate, and stable-employment percentage? A property-management company in the area should have these aggregated.
CashFlowRE · CFR-4Z2D3D20WVME85
· Data 3 weeks ago
cashflowre.app · 2026-05-29