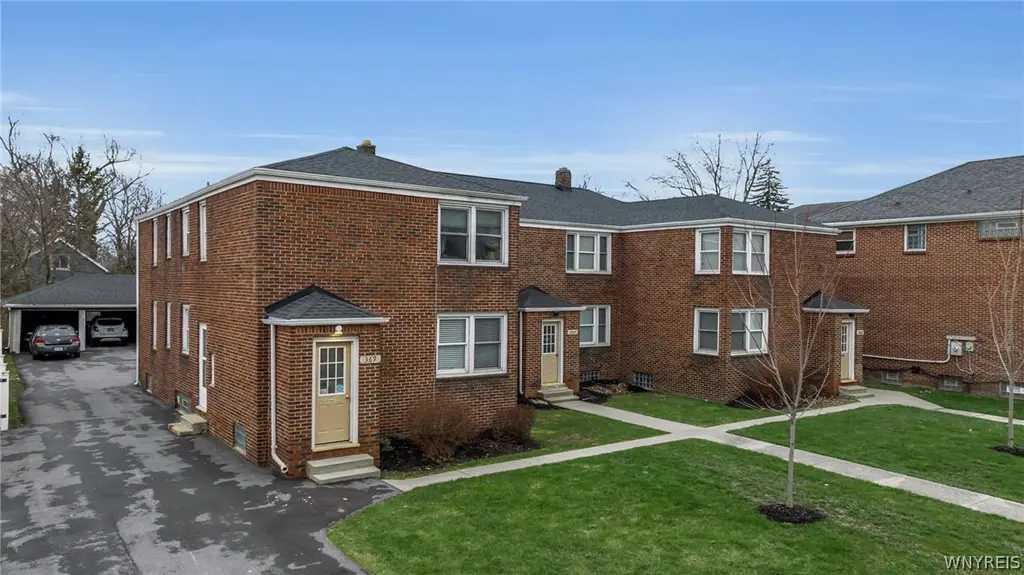
367 Potters Rd #365
West Seneca, NY 14220
$849,000C-
36 bd · None ba ·
7,888 sqft ·
Built 1955
· MultiFamily
· Active
· 30 DOM
Cashflow @ list (25.0% down · 7.5%)
Estimated rent
$7,984/mo
Mortgage (P&I)
−$4,452
Tax + insurance
−$1,188
HOA
−$0
Vac / Maint / Mgmt
−$1,677
Net cashflow
$667/mo
Annual
$8,010/yr
Cap rate
7.24%
Cash-on-cash
3.37%
DSCR
1.15
1% rule
0.94%
Cash to close
$237,720
Investor read
- This is a 4×2bd/1ba + 2×1bd/1ba units multifamily listed at $849k.
- At list price, monthly cash flow is $667 ($8k/yr) — positive. Per door: $111/mo.
- The deal already cash-flows at list — no discount required.
- To meet the 1% rule (rent ≥ 1% of price), the offer needs to be $798k (6.0% below list).
- It's been on market 30 days — a 2% lower offer ($836k) is reasonable based on typical stale-listing flexibility.
- Recommended offer: $798k (6.0% below list) — sets the bar for 1% rule.
- Local home prices are declining (-3.0%/yr); year-one equity from $6k of loan paydown is wiped out by about $25k of value loss. Plan a longer hold.
- Location reads 79/100 on livability (#130 in NY, #2,089 nationally) — a middle-class / working-renter tenant base. Strengths: housing A+, health & safety A+, crime A-; Watch: amenities D, commute F.
- West Seneca Central School District (suburban): math 49% / reading 55% proficiency, ranked #336 of 590 in NY (top 57%) — acceptable for families but not a draw, mixed tenant base, ~2y average lease.
- Watch-outs: built in 1955 — expect roof / HVAC / electrical / plumbing capex.
- Market conditions: Rents rising fast (+7.6%/yr); 138 active listings in the ZIP; 1,244 units permitted in Erie County in 2024 (563 in 5+ unit buildings).
- 2 sale attempts with the ask held roughly flat each time — persistent listings suggest the price (not the market) is what's stuck; bring a comps-based counter.
- Current owner paid $420k; list at $849k implies a 102% gain — meaningful room to come down on a strong offer.
- At projected returns (-3.0% appreciation + 7.6% rent growth), your $238k cash investment doubles in ~10 years — after that, you're playing with house money.
- Cap rate 7.2% vs local median 3.7% in West Seneca — top-decile yield for the area; either an underpriced asset or a hidden risk that comps aren't pricing in. Stress-test before assuming the spread holds.
- At $7,984/mo this rent would consume 135% of the median local household income ($71k/yr) (locally 602% of renters already pay >50% of income on rent) — very limited rent-growth headroom before tenants either downsize or default.
Questions for listing agent
- Can we see the unit-by-unit rent roll, current vacancy, and any below-market leases? What's the average tenancy length?
- What capital expenditures (roof, boiler, parking lot, exteriors) have been made in the last 5 years, and what's planned in the next 2?
- Built in 1955 — when were the roof, HVAC, electrical panel, plumbing, and water heater last replaced?
- Is there a deadline driving the sale (1031 exchange, divorce, estate, relocation)? That informs how much negotiation room exists.
- Schools are B-rated — typically a magnet for longer-tenancy family renters. What's the average tenant stay here, and is there a school-zone premium baked into asking?
- What's the average days-on-market for RENTAL listings here right now (not sales)? A rising rental-DOM trend means longer vacancies and softer asking-rent achievability than the comps imply.
- What's the recent tenant-quality profile in this submarket — average credit score on applications, eviction rate, late-payment / NSF rate, and stable-employment percentage? A property-management company in the area should have these aggregated.
- How much new apartment / multifamily construction is in the pipeline within 1–3 miles? Heavy new supply (>2% of stock underway) typically softens rents 12–24 months out; light construction supports rent growth.
CashFlowRE · CFR-4ZZ4Y68AY83R97
· Data 23 h ago
cashflowre.app · 2026-05-29