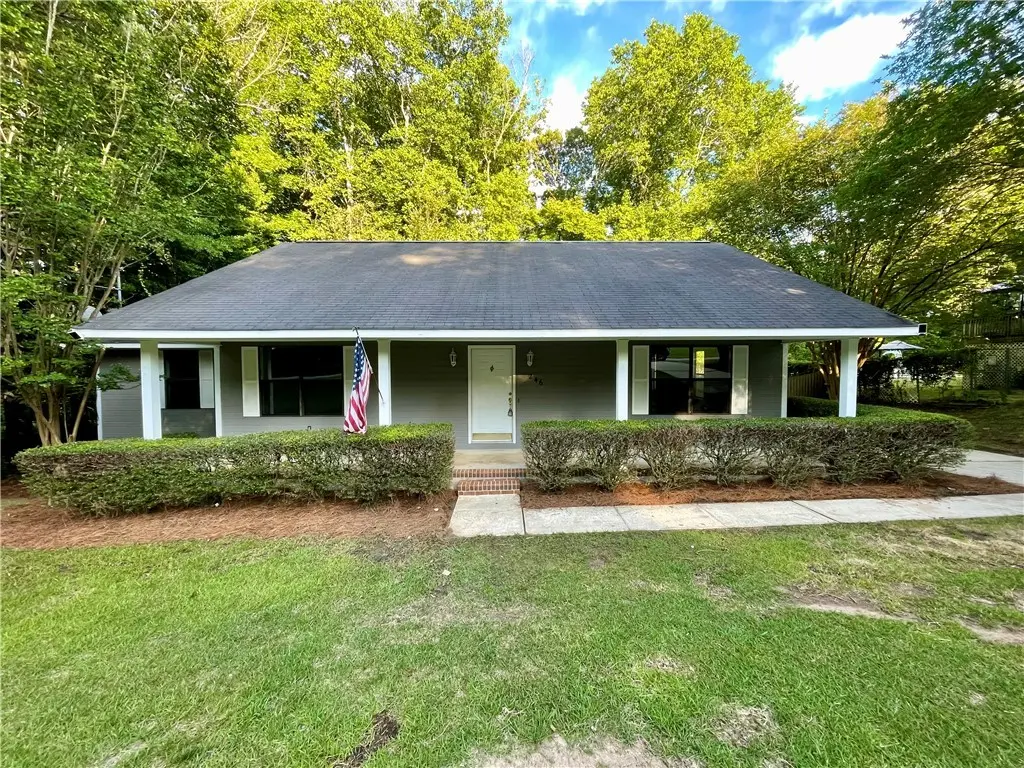
246 Creek Nation Dr
Auburn, AL 36830
$289,000D-
3 bd · 1.0 ba ·
1,546 sqft ·
Built 1987
· SingleFamily
· Pending
· 4 DOM
Cashflow @ list (25.0% down · 7.5%)
Estimated rent
$2,275/mo
Mortgage (P&I)
−$1,516
Tax + insurance
−$292
HOA
−$0
Vac / Maint / Mgmt
−$478
Net cashflow
$-10/mo
Annual
$-126/yr
Cap rate
6.25%
Cash-on-cash
-0.16%
DSCR
0.99
1% rule
0.79%
Cash to close
$80,920
Investor read
- This is a 3-bed/1.0-bath single-family listed at $289k.
- At list price, monthly cash flow is $-10 ($-126/yr) — negative.
- To cash-flow at today's rent, offer at most $287k (0.6% below list).
- To meet the 1% rule (rent ≥ 1% of price), the offer needs to be $228k (21.3% below list).
- Only 4 days on market — expect competitive offers; lowballing is unlikely to land.
- Recommended offer: $228k (21.3% below list) — sets the bar for 1% rule.
- Local home prices are declining (-3.0%/yr); year-one equity from $2k of loan paydown is wiped out by about $9k of value loss. Plan a longer hold.
- Location reads 80/100 on livability (#6 in AL, #1,842 nationally) — a professional / high-income tenant draw. Strengths: crime A+, amenities A+, health & safety A+; Watch: commute F.
- Auburn City (urban): math 51% / reading 69% proficiency, ranked #7 of 129 in AL (top 5%) — acceptable for families but not a draw, mixed tenant base, ~2y average lease.
- Zoned schools: Wrights Mill Road Elementary School (math 65% / reading 75%, grade A-, #26 of 627 statewide, top 4%, 397 students, 33% FRL).
- Market conditions: Rents rising fast (+5.4%/yr); 899 active listings in the ZIP; 2 comparable units currently listed for rent nearby; 1,858 units permitted in Lee County in 2024 (113 in 5+ unit buildings).
- Lee County population projected at +54% by 2050 — long-run rental-demand tailwind backs the buy-and-hold thesis.
- Climate carrying-cost: major wind risk, 68% chance of damaging wind over 30y; extreme-heat days projected 7→19/yr by 2055 (HVAC capex compounding) — expect insurance premiums to compound above CPI over the hold.
- Cap rate 6.2% vs local median 2.7% in Auburn — top-decile yield for the area; either an underpriced asset or a hidden risk that comps aren't pricing in. Stress-test before assuming the spread holds.
- This rent runs 39% of the median local income ($70k/yr) — at the standard rent-burdened threshold; future hikes will face affordability resistance.
Questions for listing agent
- What do current leases actually rent for vs. the listed asking? Can we see a recent rent roll and the last 12 months of T-12 income?
- Is there a deadline driving the sale (1031 exchange, divorce, estate, relocation)? That informs how much negotiation room exists.
- Schools are A-rated — typically a magnet for longer-tenancy family renters. What's the average tenant stay here, and is there a school-zone premium baked into asking?
- The area grade is low — what's the realistic commute time and amenity access for the typical tenant pool here? Any planned neighborhood developments (good or bad) we should know about?
- What's the average days-on-market for RENTAL listings here right now (not sales)? A rising rental-DOM trend means longer vacancies and softer asking-rent achievability than the comps imply.
- What's the recent tenant-quality profile in this submarket — average credit score on applications, eviction rate, late-payment / NSF rate, and stable-employment percentage? A property-management company in the area should have these aggregated.
- How much new for-sale + rental construction is in the pipeline within 1–3 miles? Heavy new supply typically softens prices + rents 12–24 months out; constrained supply supports both.
CashFlowRE · CFR-50GHF2DZ24MHGR
· Data 3 weeks ago
cashflowre.app · 2026-05-29