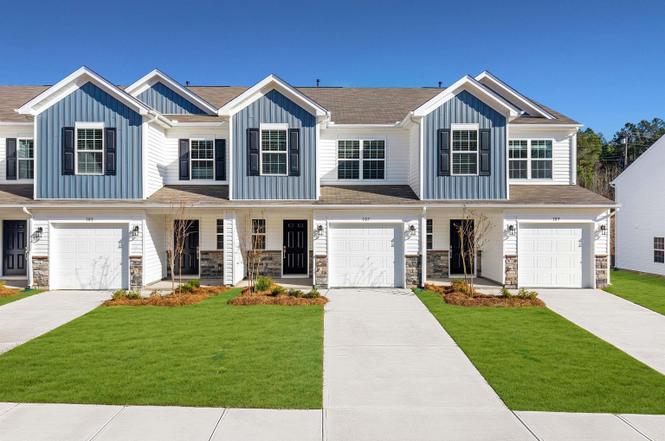
107 Tango Dr Unit SDT 4 Magnolia A
Clinton, SC 29325
$167,999C-
3 bd · 2.5 ba ·
1,403 sqft ·
Built 2025
· Townhouse
· Pending
· 80 DOM
Cashflow @ list (25.0% down · 7.5%)
Estimated rent
$1,900/mo
Mortgage (P&I)
−$881
Tax + insurance
−$280
HOA
−$184
Vac / Maint / Mgmt
−$399
Net cashflow
$156/mo
Annual
$1,872/yr
Cap rate
7.41%
Cash-on-cash
3.98%
DSCR
1.18
1% rule
1.13%
Cash to close
$47,040
Investor read
- This is a 3-bed/2.5-bath townhouse listed at $168k. Condition is rated good.
- At list price, monthly cash flow is $156 ($2k/yr) — positive.
- The deal already cash-flows at list — no discount required.
- Meets the 1% rule at list price ($2k rent vs $168k).
- It's been on market 80 days — a 6% lower offer ($158k) is reasonable based on typical stale-listing flexibility.
- Recommended offer: $158k (6.0% below list) — sets the bar for market timing.
- Local home prices are declining (-3.0%/yr); year-one equity from $1k of loan paydown is wiped out by about $5k of value loss. Plan a longer hold.
- Location reads 56/100 on livability (#296 in SC) — a working-class tenant base; expect higher turnover. Strengths: cost of living A+, housing A+; Watch: crime F, amenities F, commute F.
- Laurens 56 (rural): math 35% / reading 40% proficiency, ranked #38 of 80 in SC (top 48%) — families likely to look elsewhere, expect single-tenant / working-renter base with shorter leases; 73% free/reduced lunch — lower-income household profile, screen leases tightly.
- Zoned schools: Eastside Elementary (math 32% / reading 32%, grade F, #369 of 597 statewide, top 64%, 466 students, 100% FRL) — zoned schools average 100% FRL vs 73% district-wide (27 pts higher); higher-poverty schools than district average — tighter screening recommended.
- Market conditions: 128 active listings in the ZIP; 1 comparable units currently listed for rent nearby; 621 units permitted in Laurens County in 2024 (0 in 5+ unit buildings).
- Laurens County population projected to shrink 7% by 2050 — rents likely to lag national; underwrite the cash flow, not the appreciation.
- 3 sale attempts with the ask held roughly flat each time — persistent listings suggest the price (not the market) is what's stuck; bring a comps-based counter.
- Cap rate 7.4% vs local median 5.1% in Clinton — top-decile yield for the area; either an underpriced asset or a hidden risk that comps aren't pricing in. Stress-test before assuming the spread holds.
Questions for listing agent
- It's been on market 80 days. Have you received any prior offers? Is the seller open to a 6% concession, seller financing, or rate buy-down credit?
- What does the HOA fee cover, when was the last increase, and are there any pending special assessments or reserve-fund shortfalls?
- Why hasn't it sold? Are there any deal-killer items the seller is aware of (foundation, flood, title, zoning, code violations)?
- Is there a deadline driving the sale (1031 exchange, divorce, estate, relocation)? That informs how much negotiation room exists.
- Schools are D-rated, which usually means shorter tenancies and higher turnover. Who's the typical renter profile here, and what's been the actual vacancy rate?
- Crime grade is F in this area — have there been break-ins, vandalism, or insurance claims at this property in the last 3 years? What carrier currently insures it and at what premium?
- What's the average days-on-market for RENTAL listings here right now (not sales)? A rising rental-DOM trend means longer vacancies and softer asking-rent achievability than the comps imply.
- What's the recent tenant-quality profile in this submarket — average credit score on applications, eviction rate, late-payment / NSF rate, and stable-employment percentage? A property-management company in the area should have these aggregated.
CashFlowRE · CFR-53D8D45ADWKZFG
· Data 1 week ago
cashflowre.app · 2026-05-29